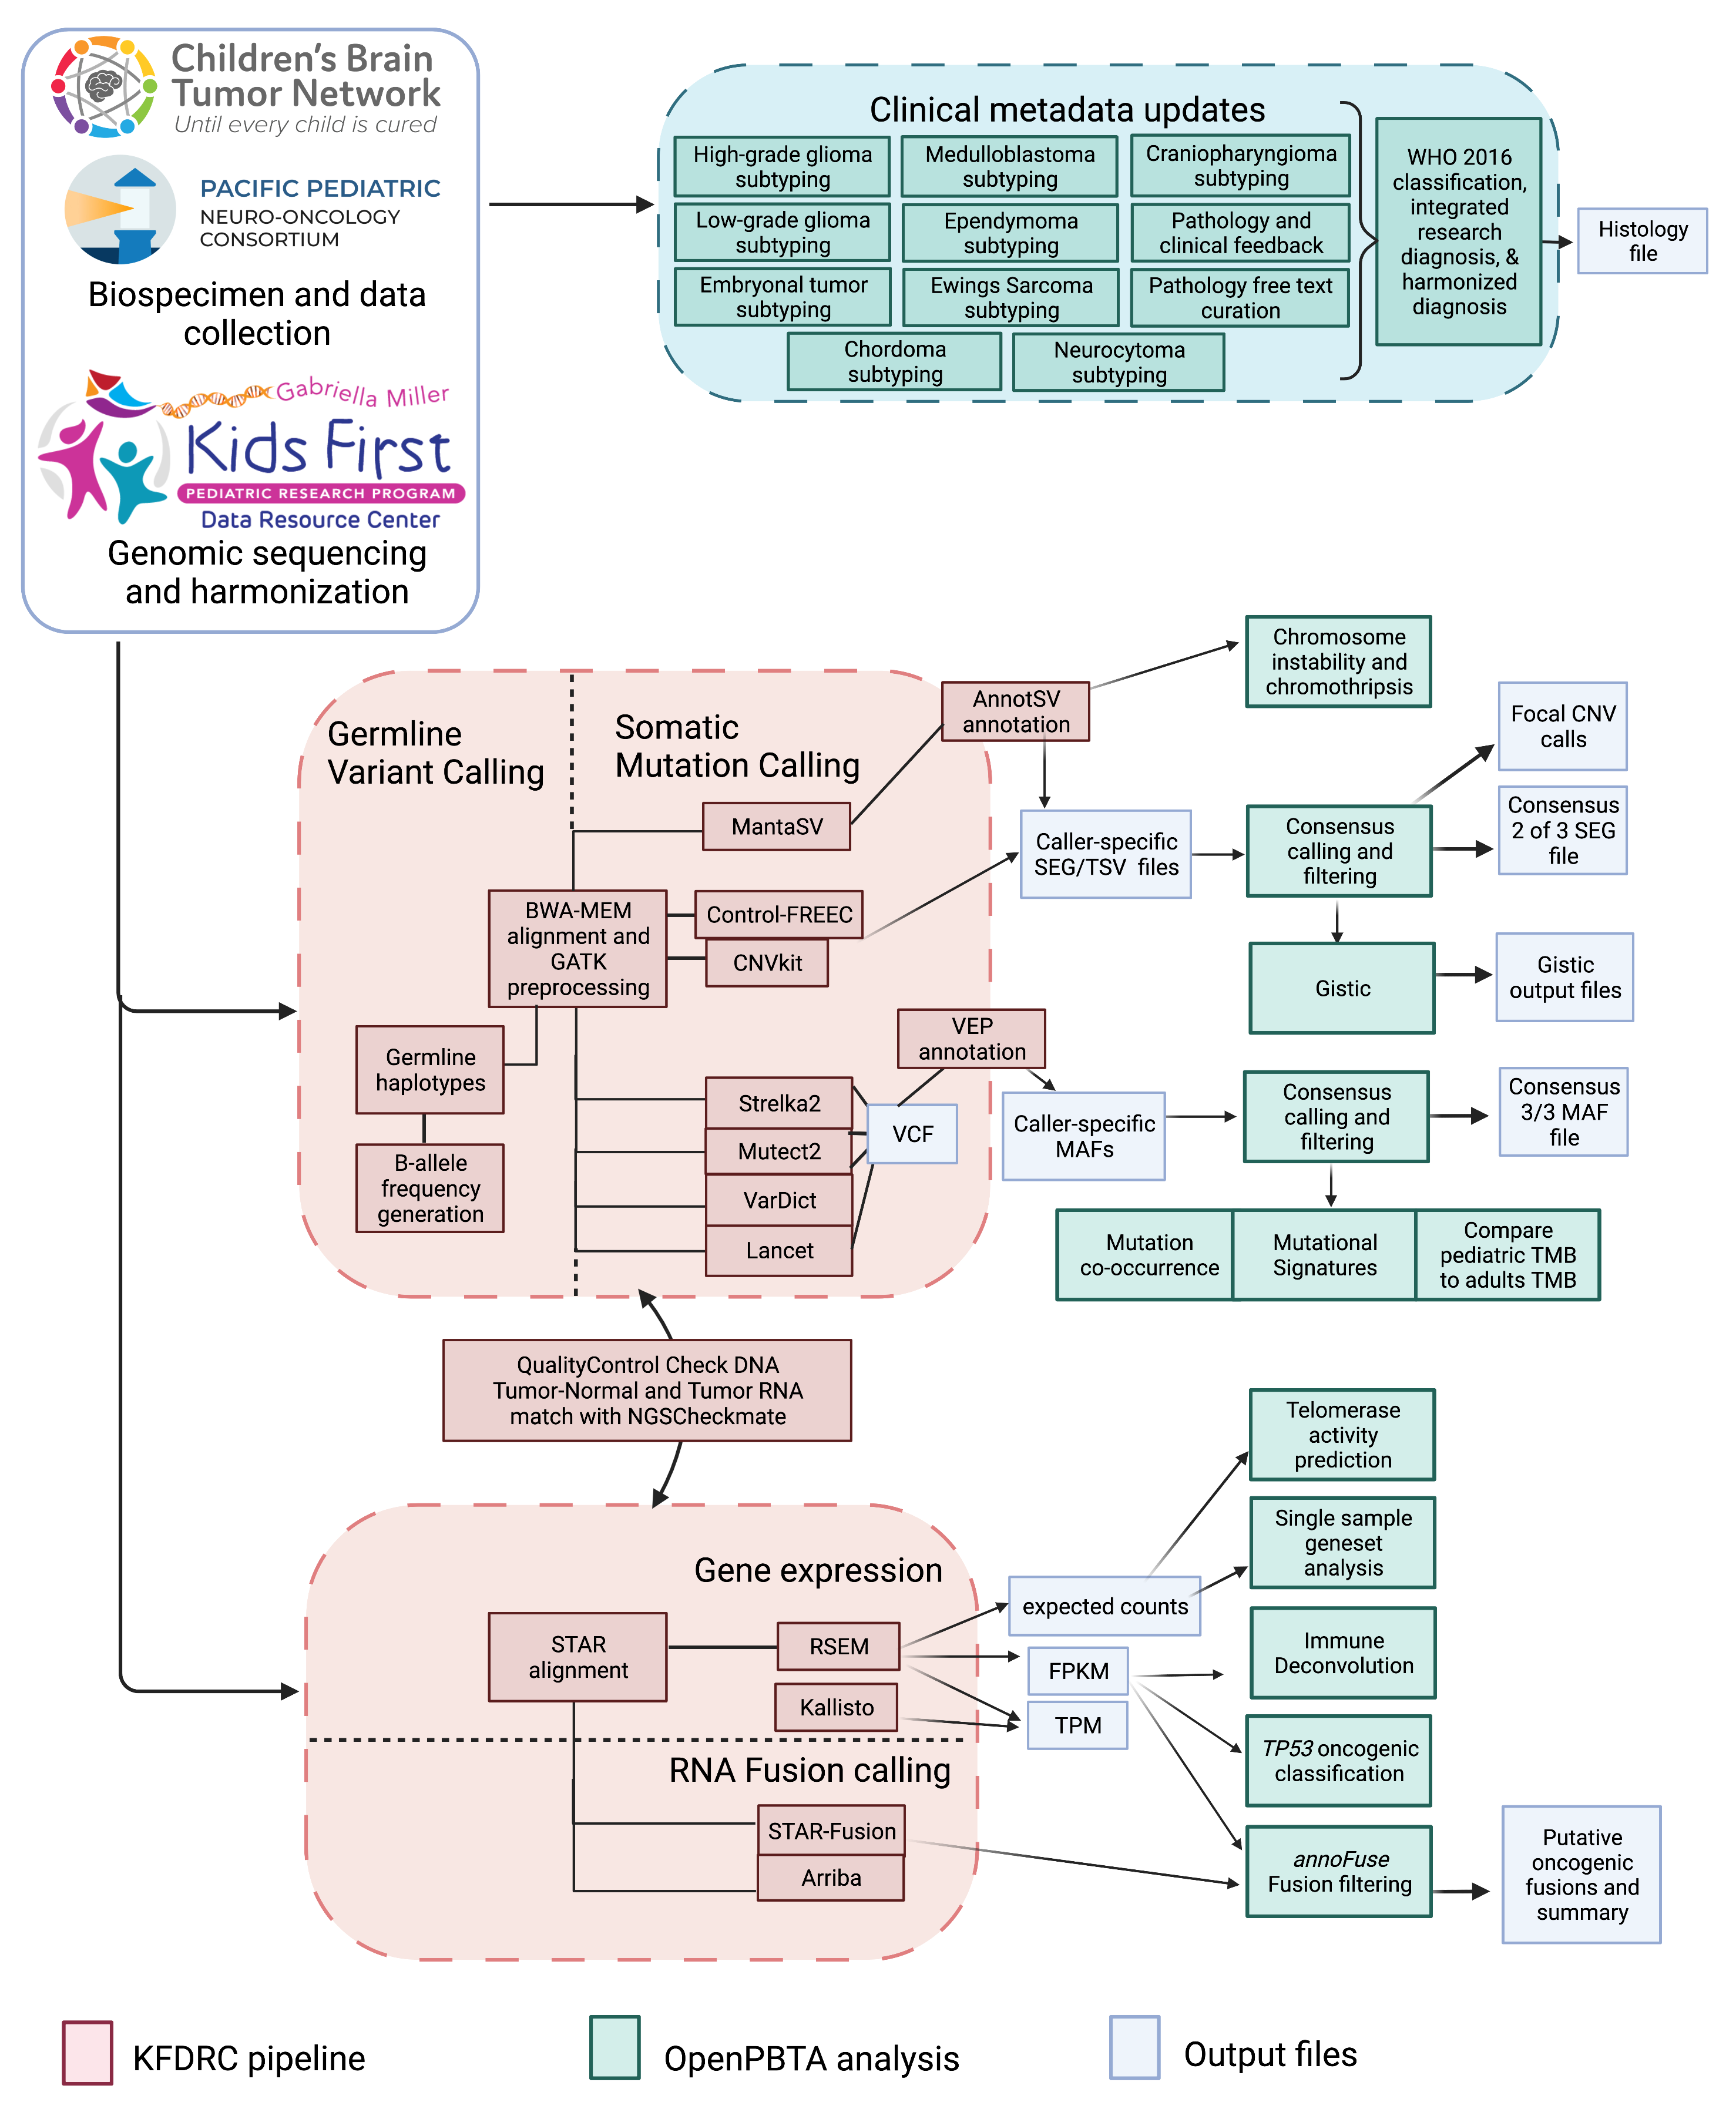
 {#fig:S1 tag="S1" width="7in"}
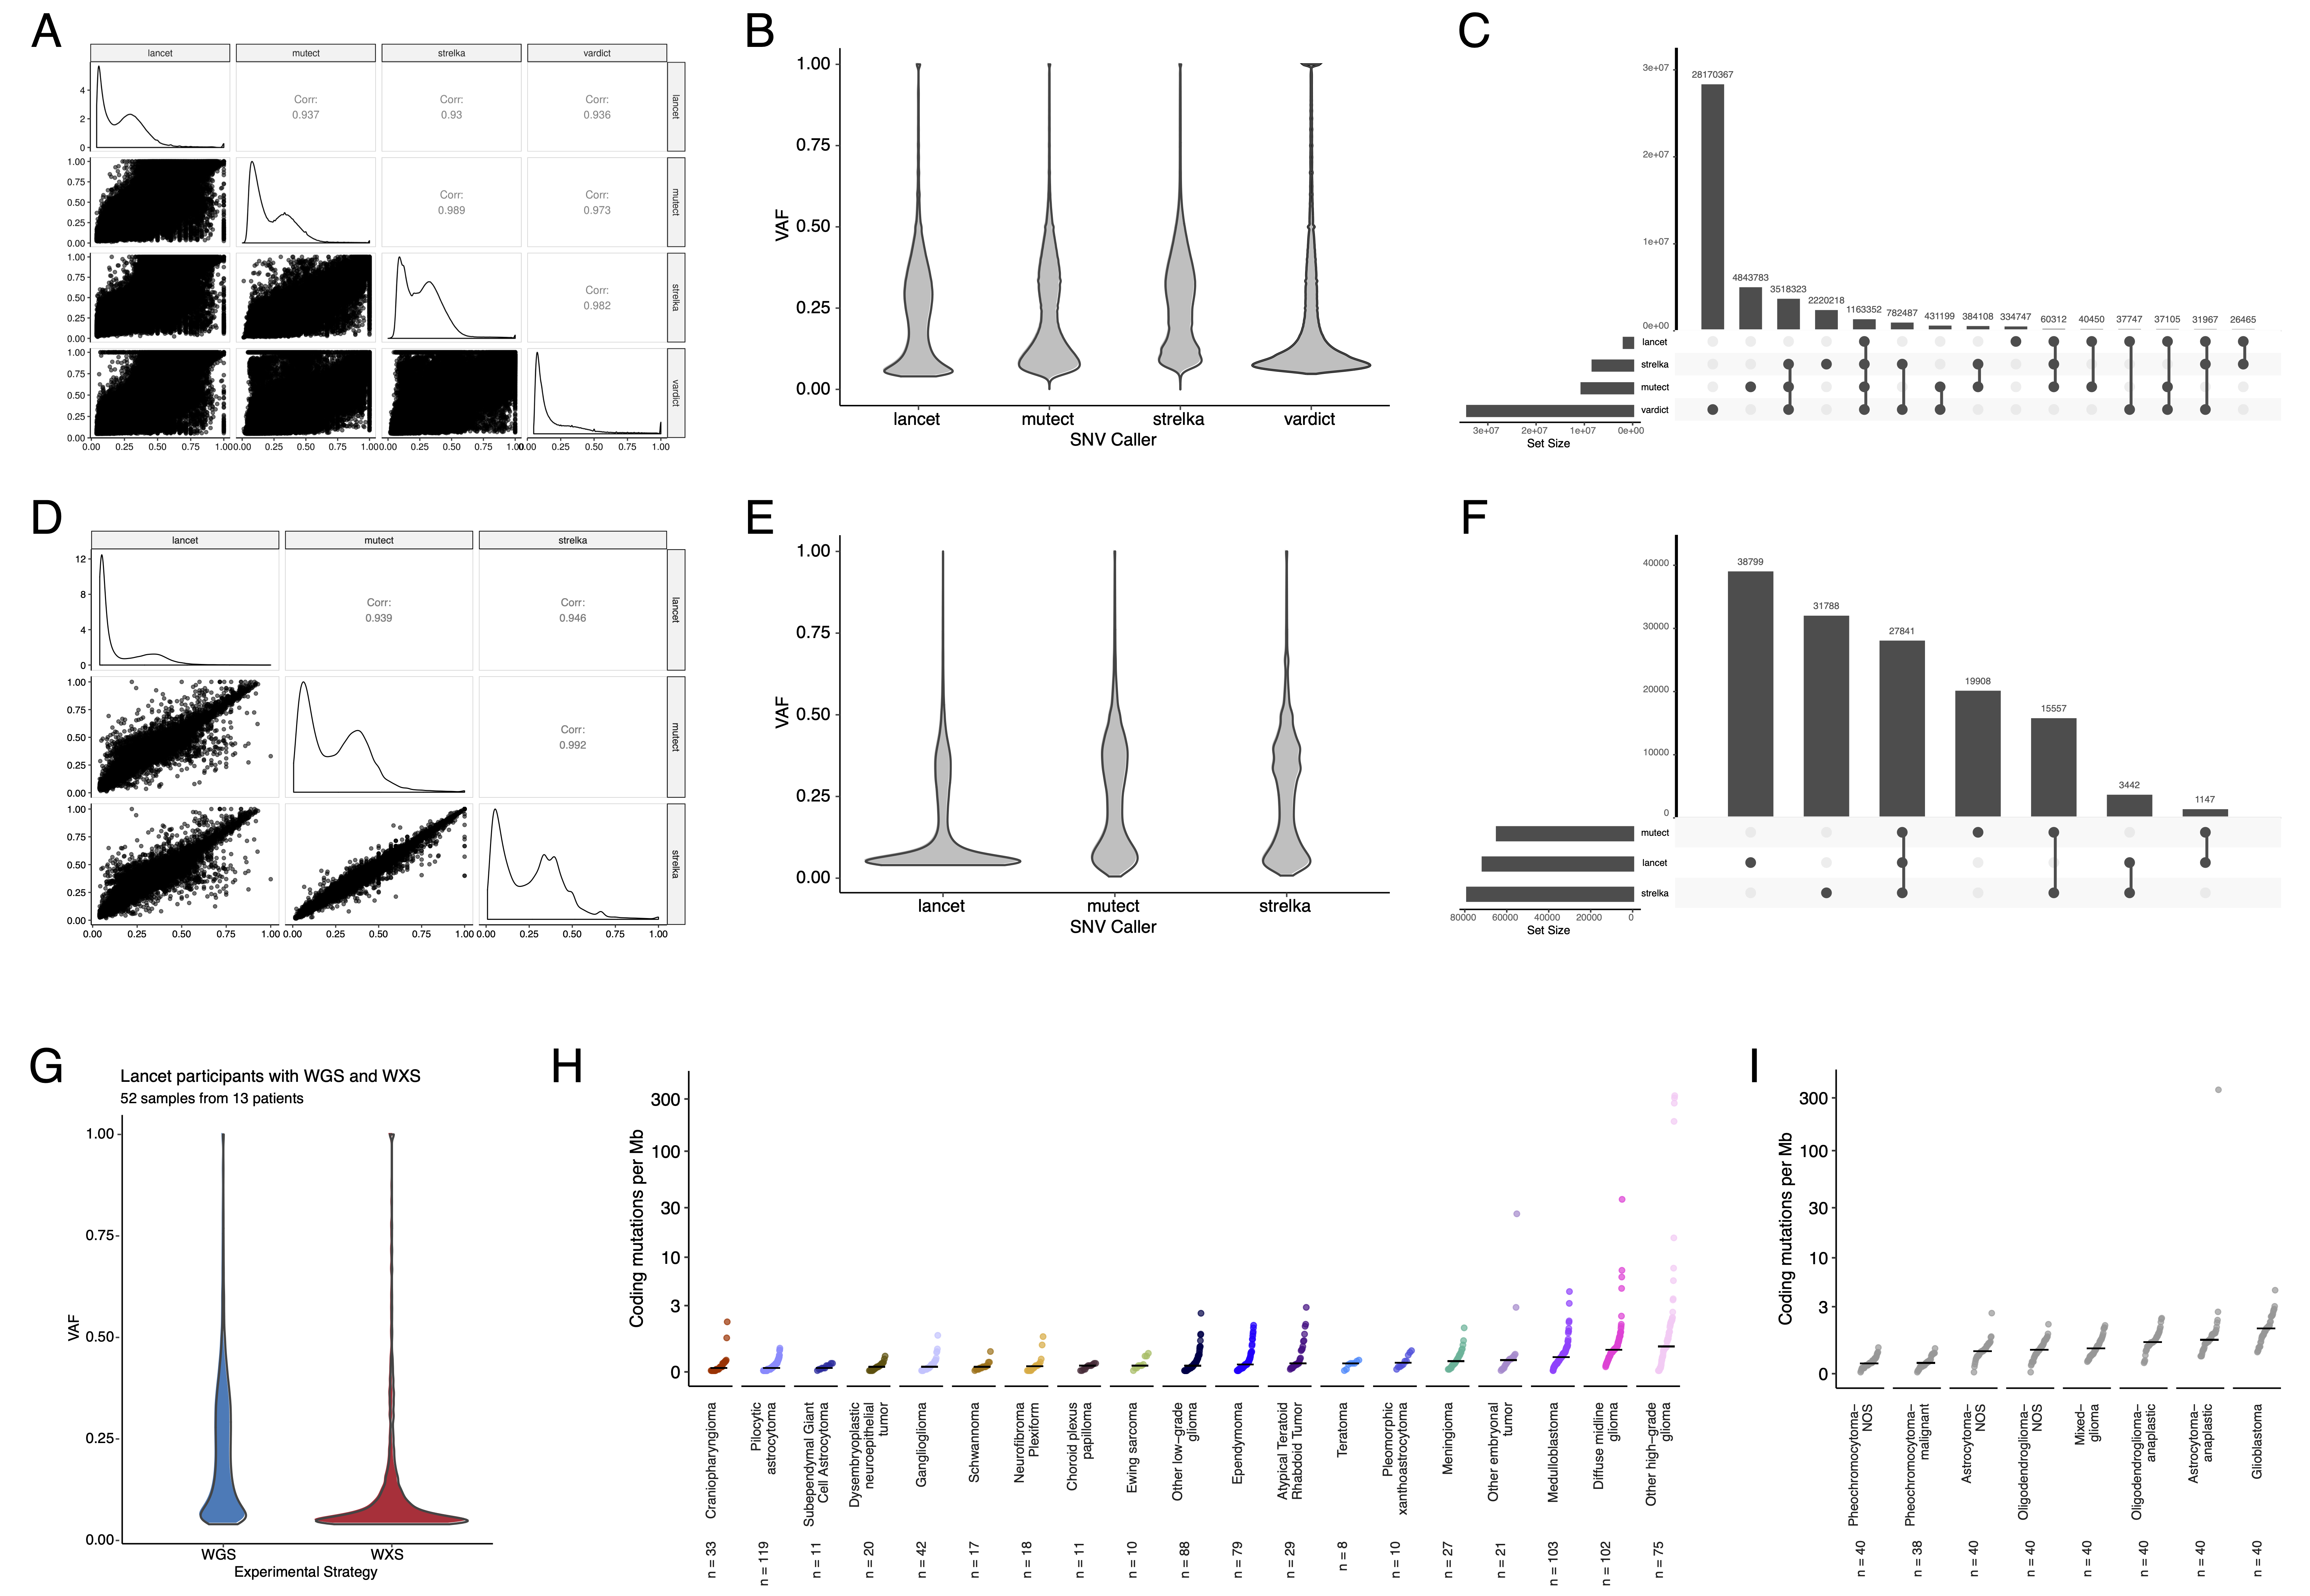 {#fig:S2 tag="S2" width="7in"}
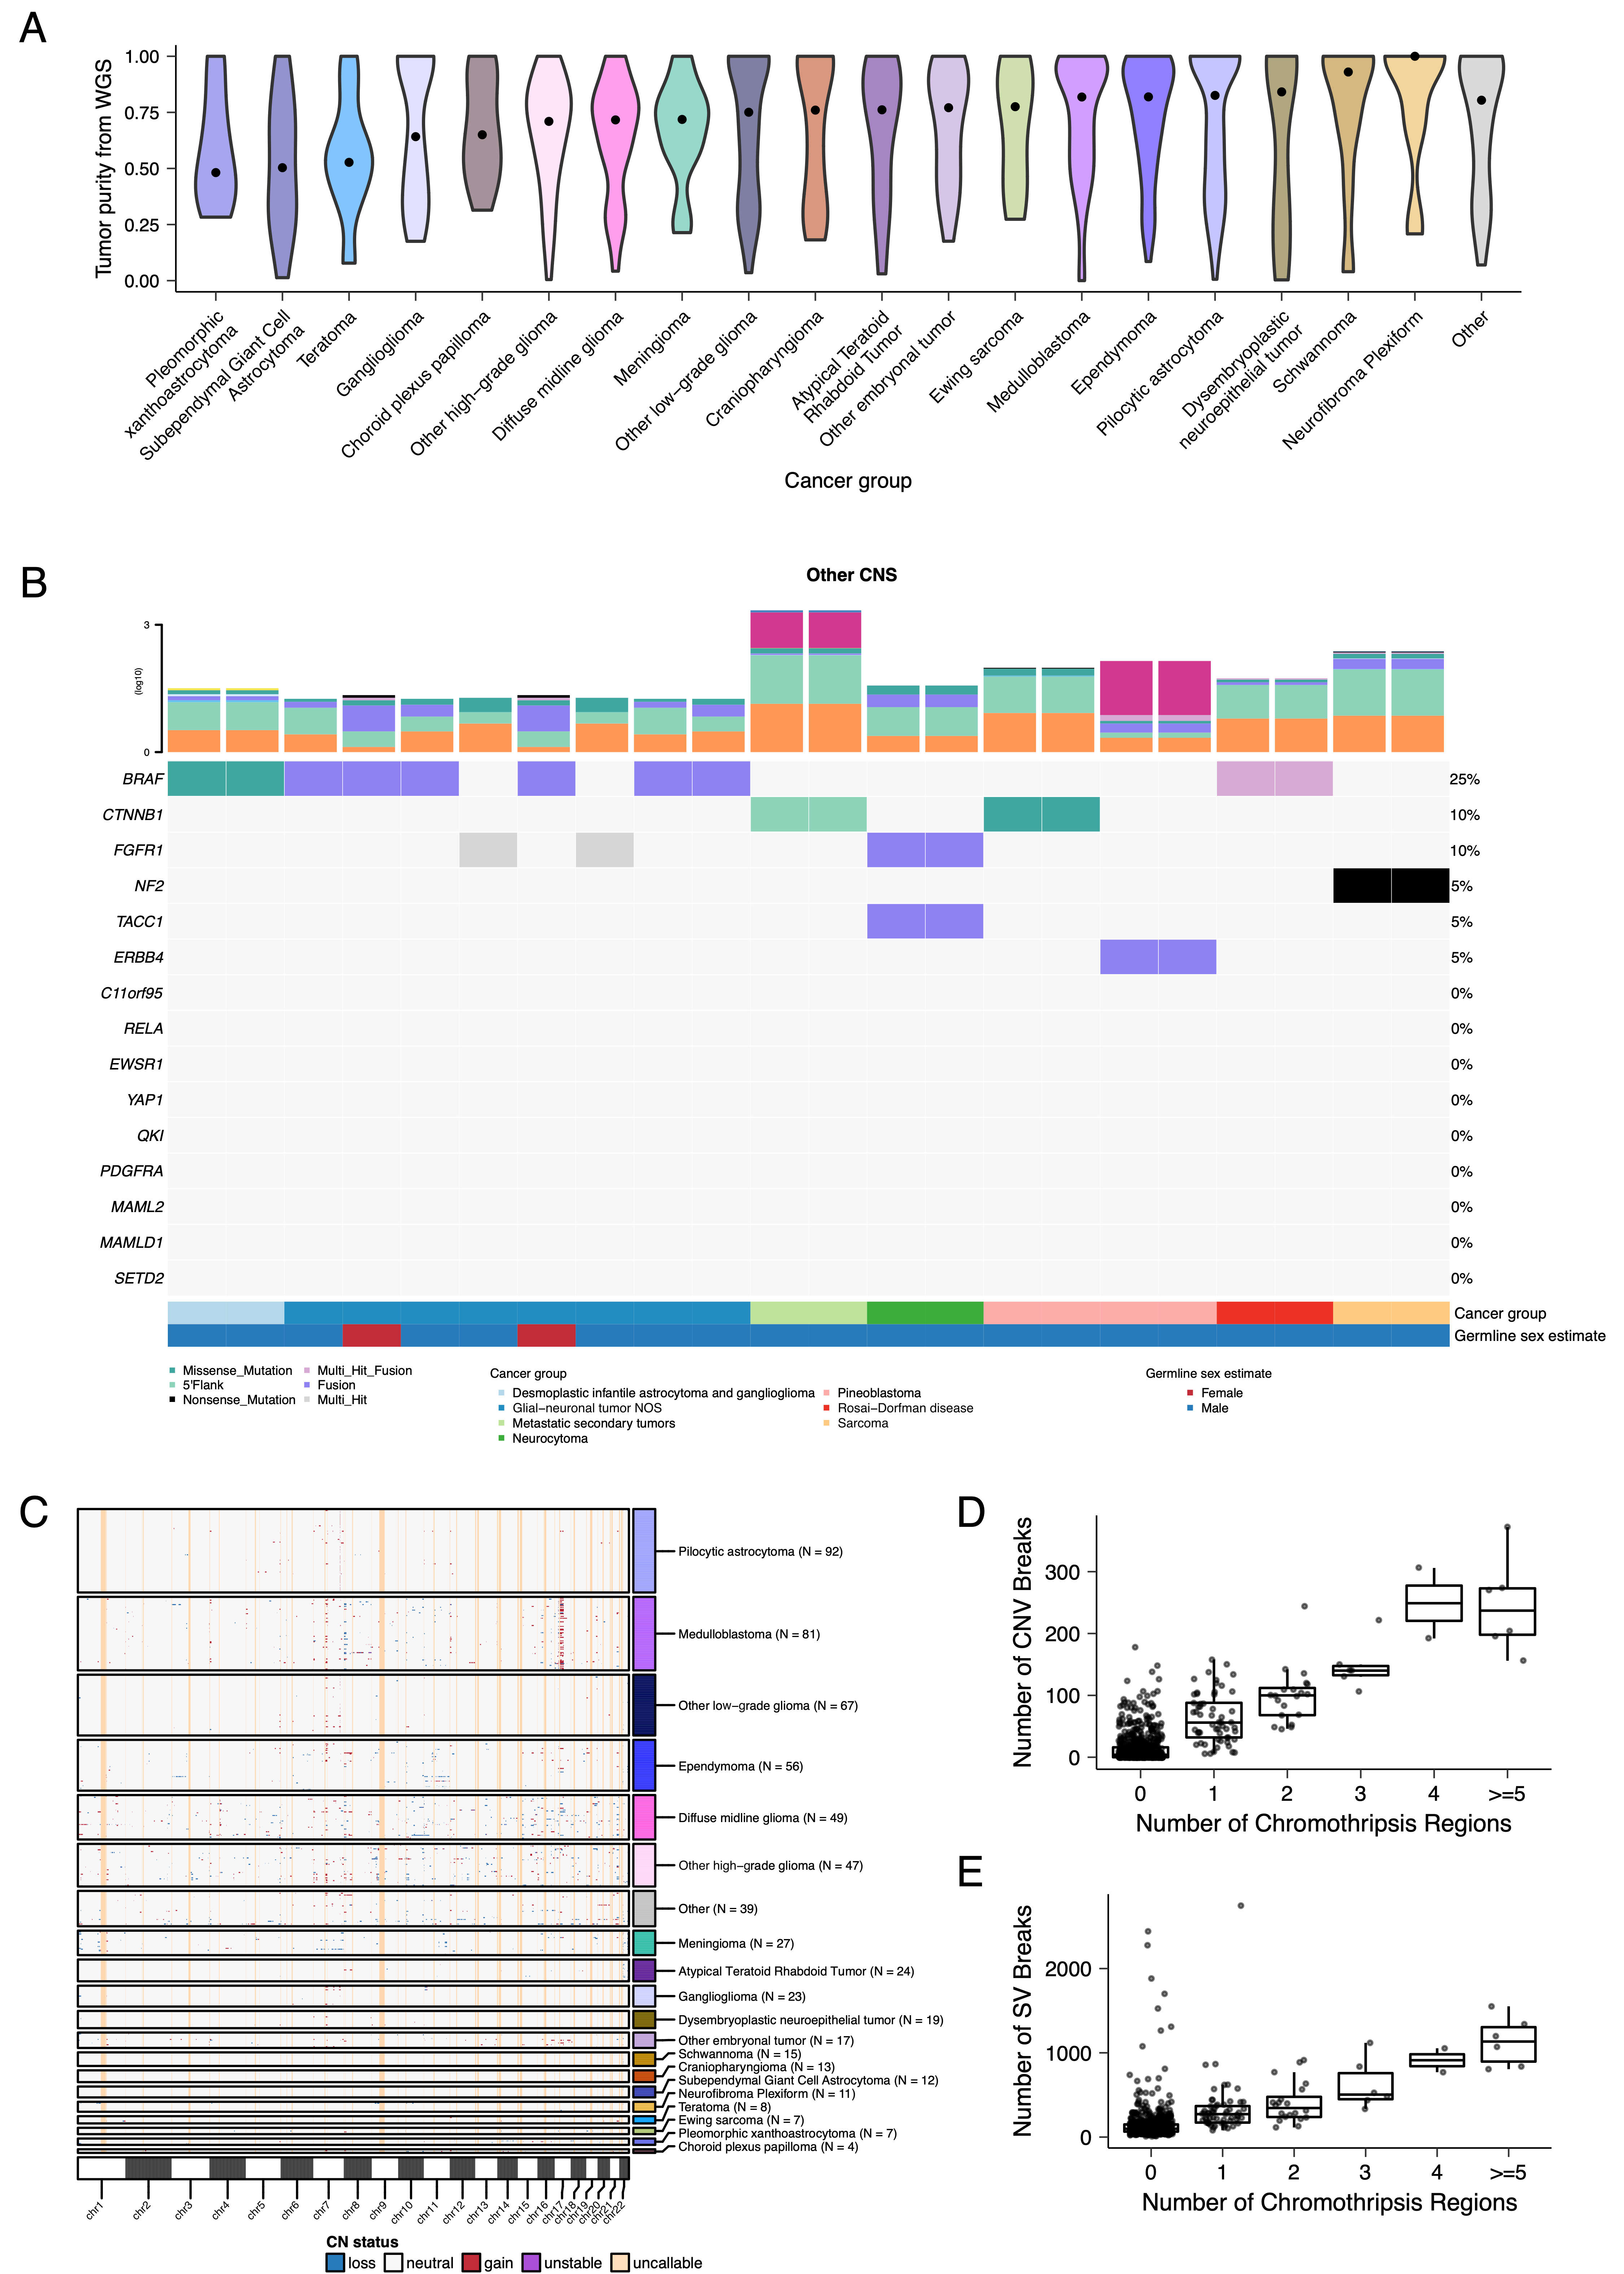 {#fig:S3 tag="S3" width="7in"}
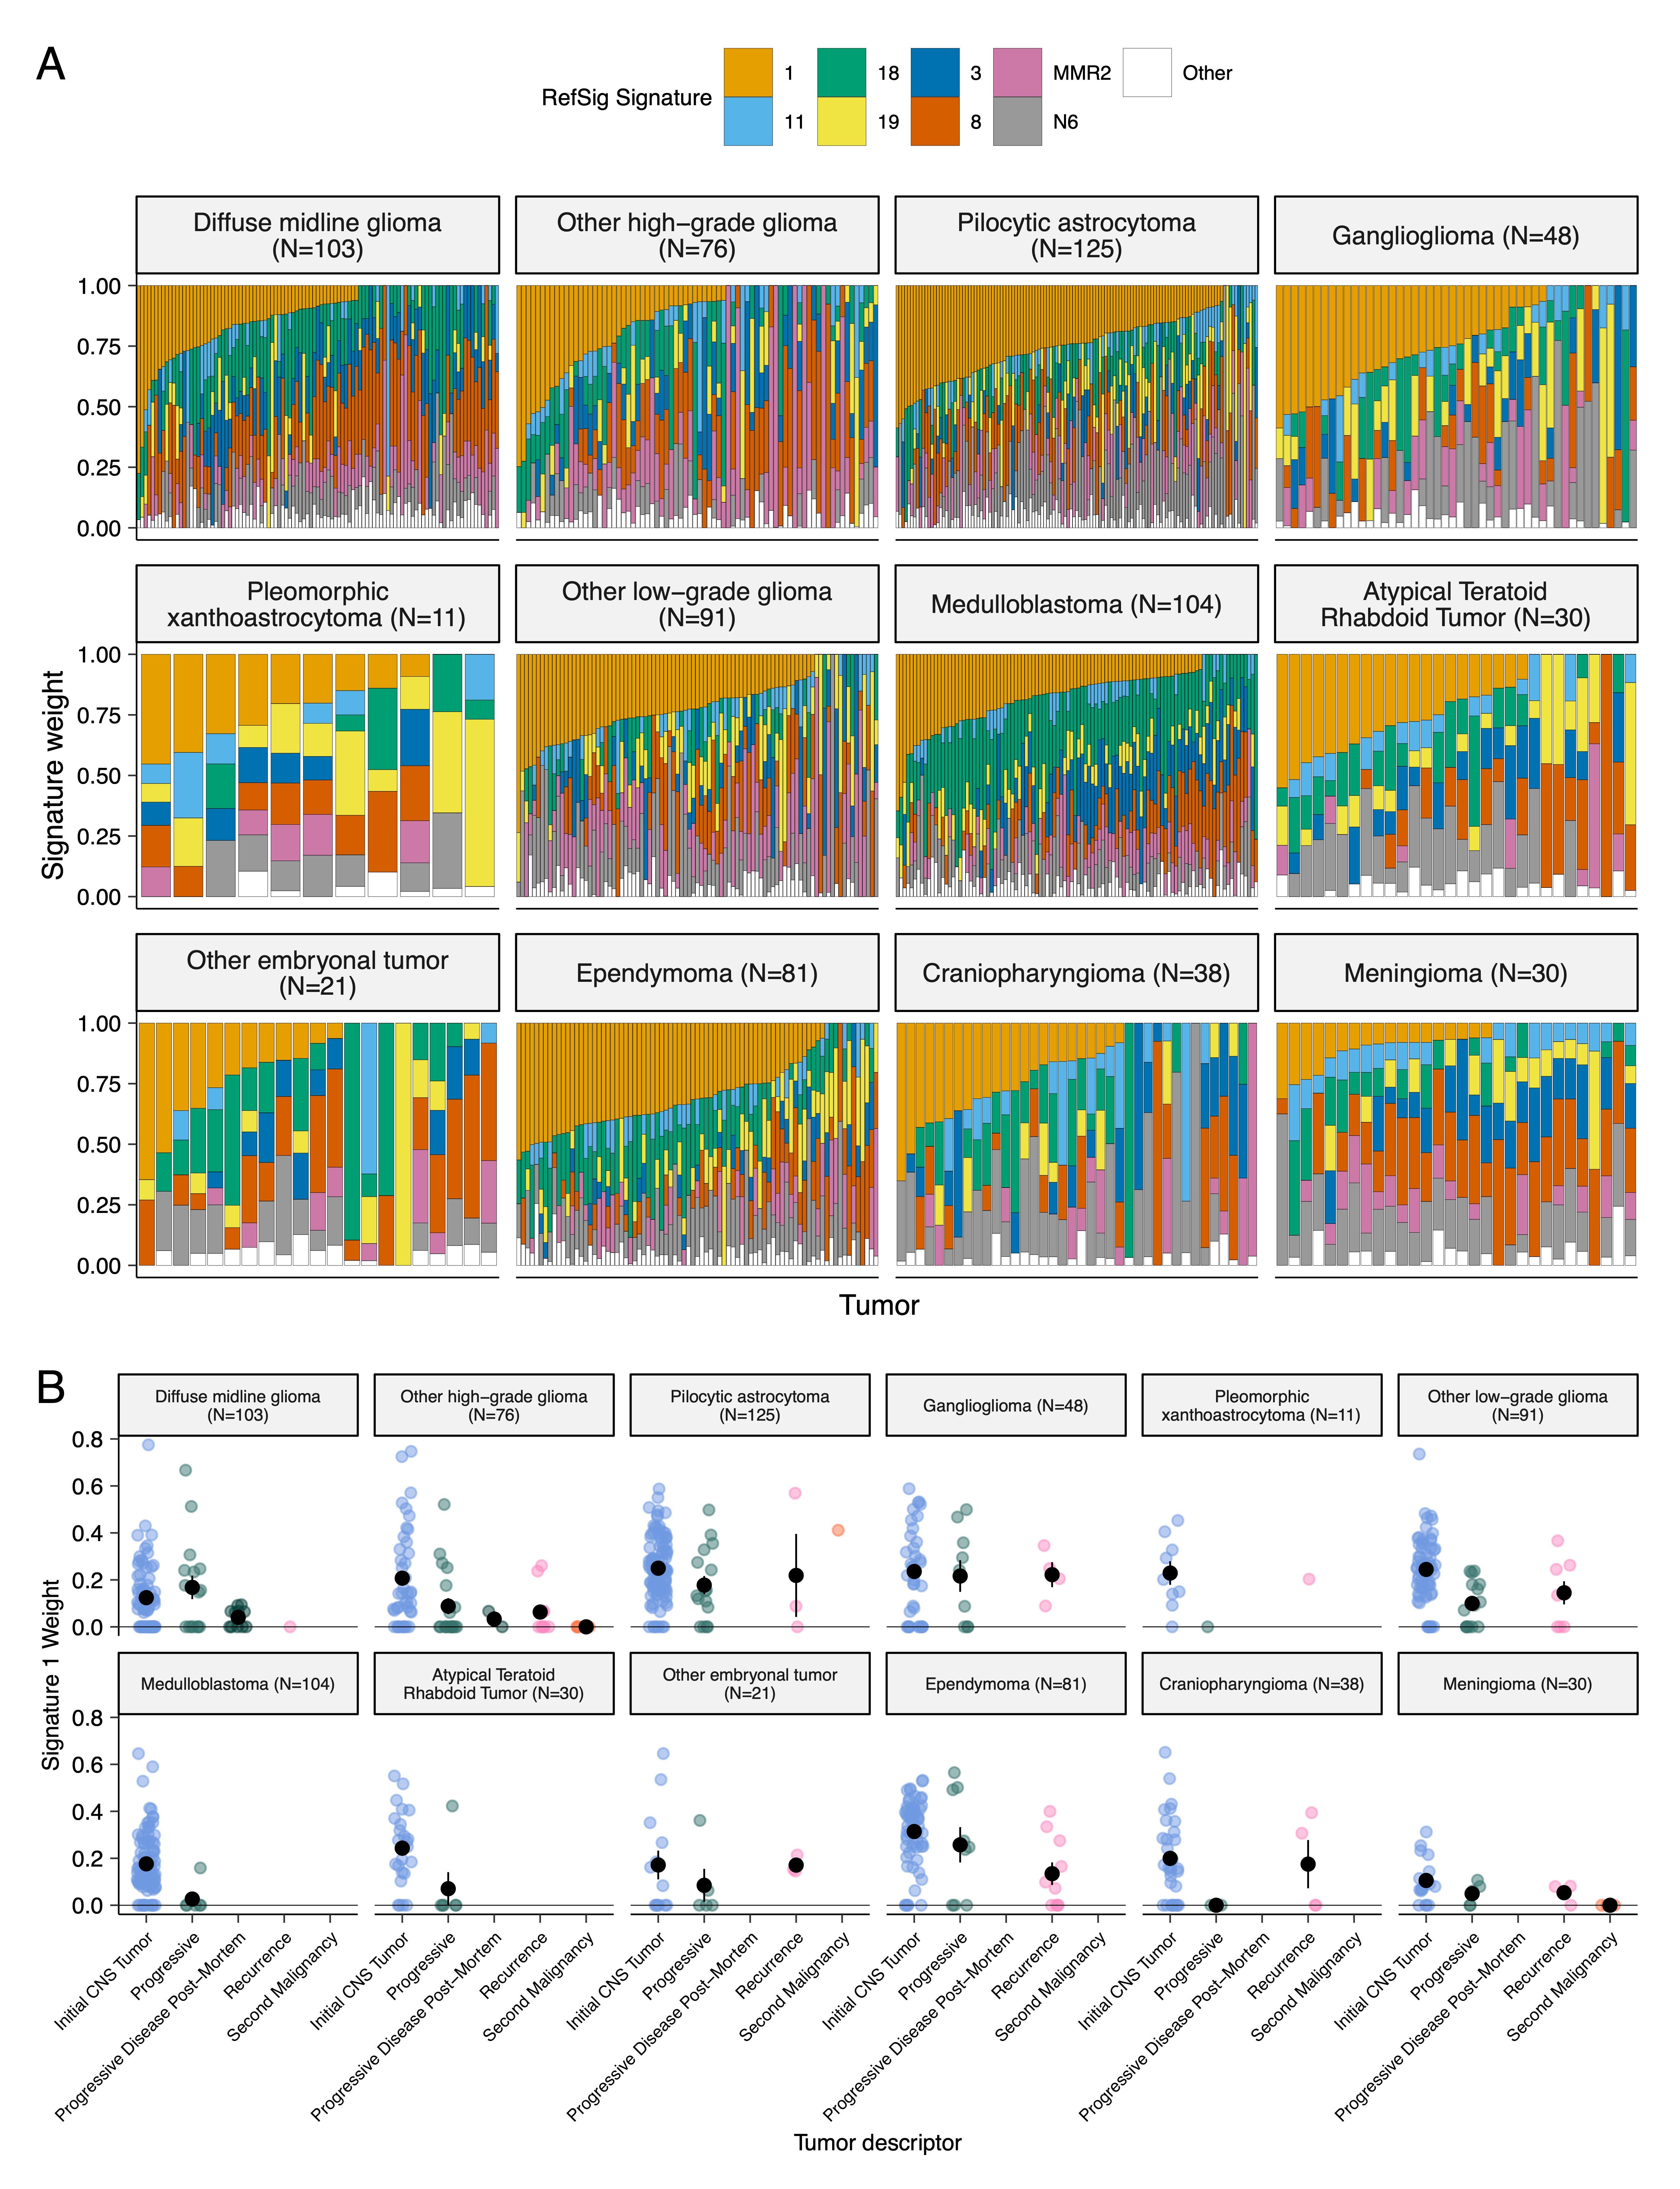 {#fig:S4 tag="S4" width="7in"}
 {#fig:S5 tag="S5" width="7in"}
 {#fig:S6 tag="S6" width="7in"}
 {#fig:S7 tag="S7" width="7in"}
Table S1. Related to Figure 1. Table of specimens and associated metadata, clinical data, and histological data utilized in the OpenPBTA project.
Table S2. Related to Figures 2 and 3. Excel file with four sheets, where the first three represent tables of TMB, eight CNS mutational signatures, and chromothripsis events per sample, respectively, and the fourth sheet shows summarized genomic alterations across cancer groups.
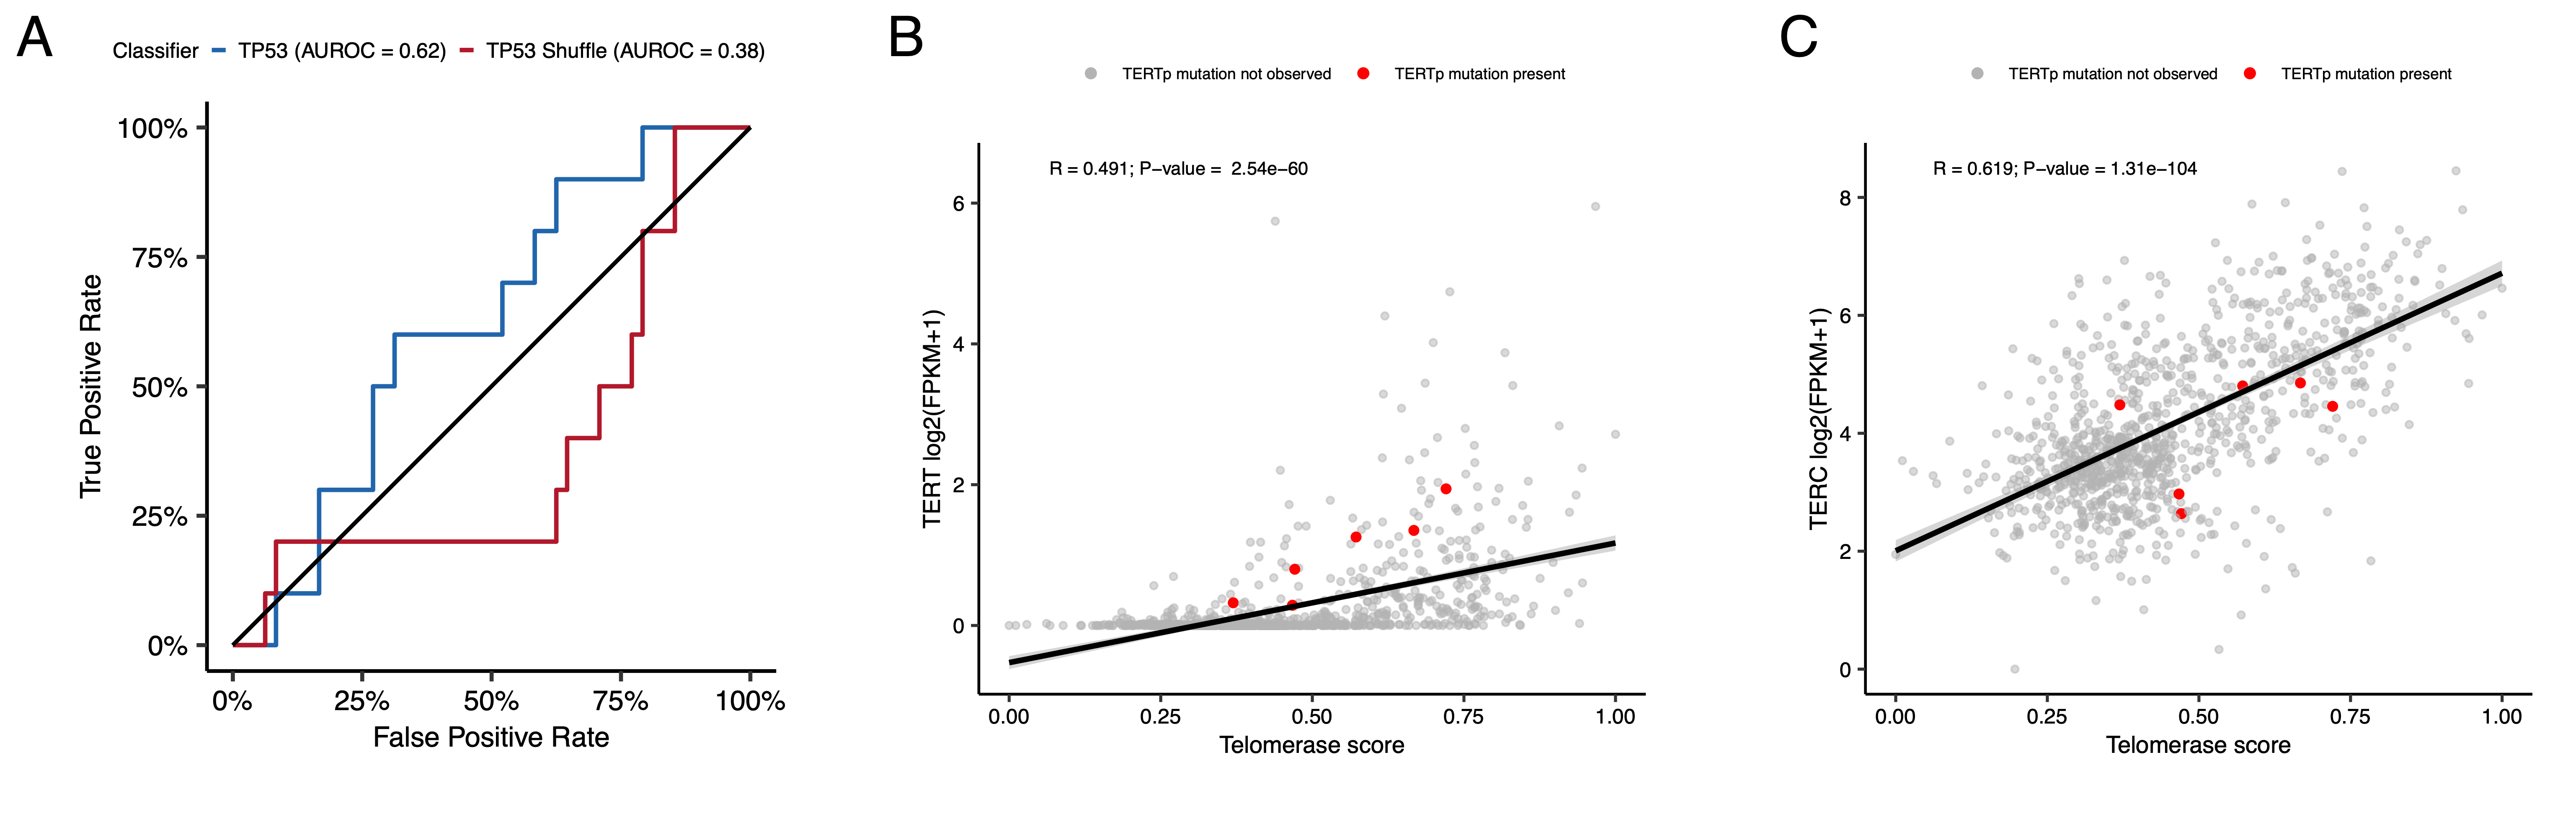
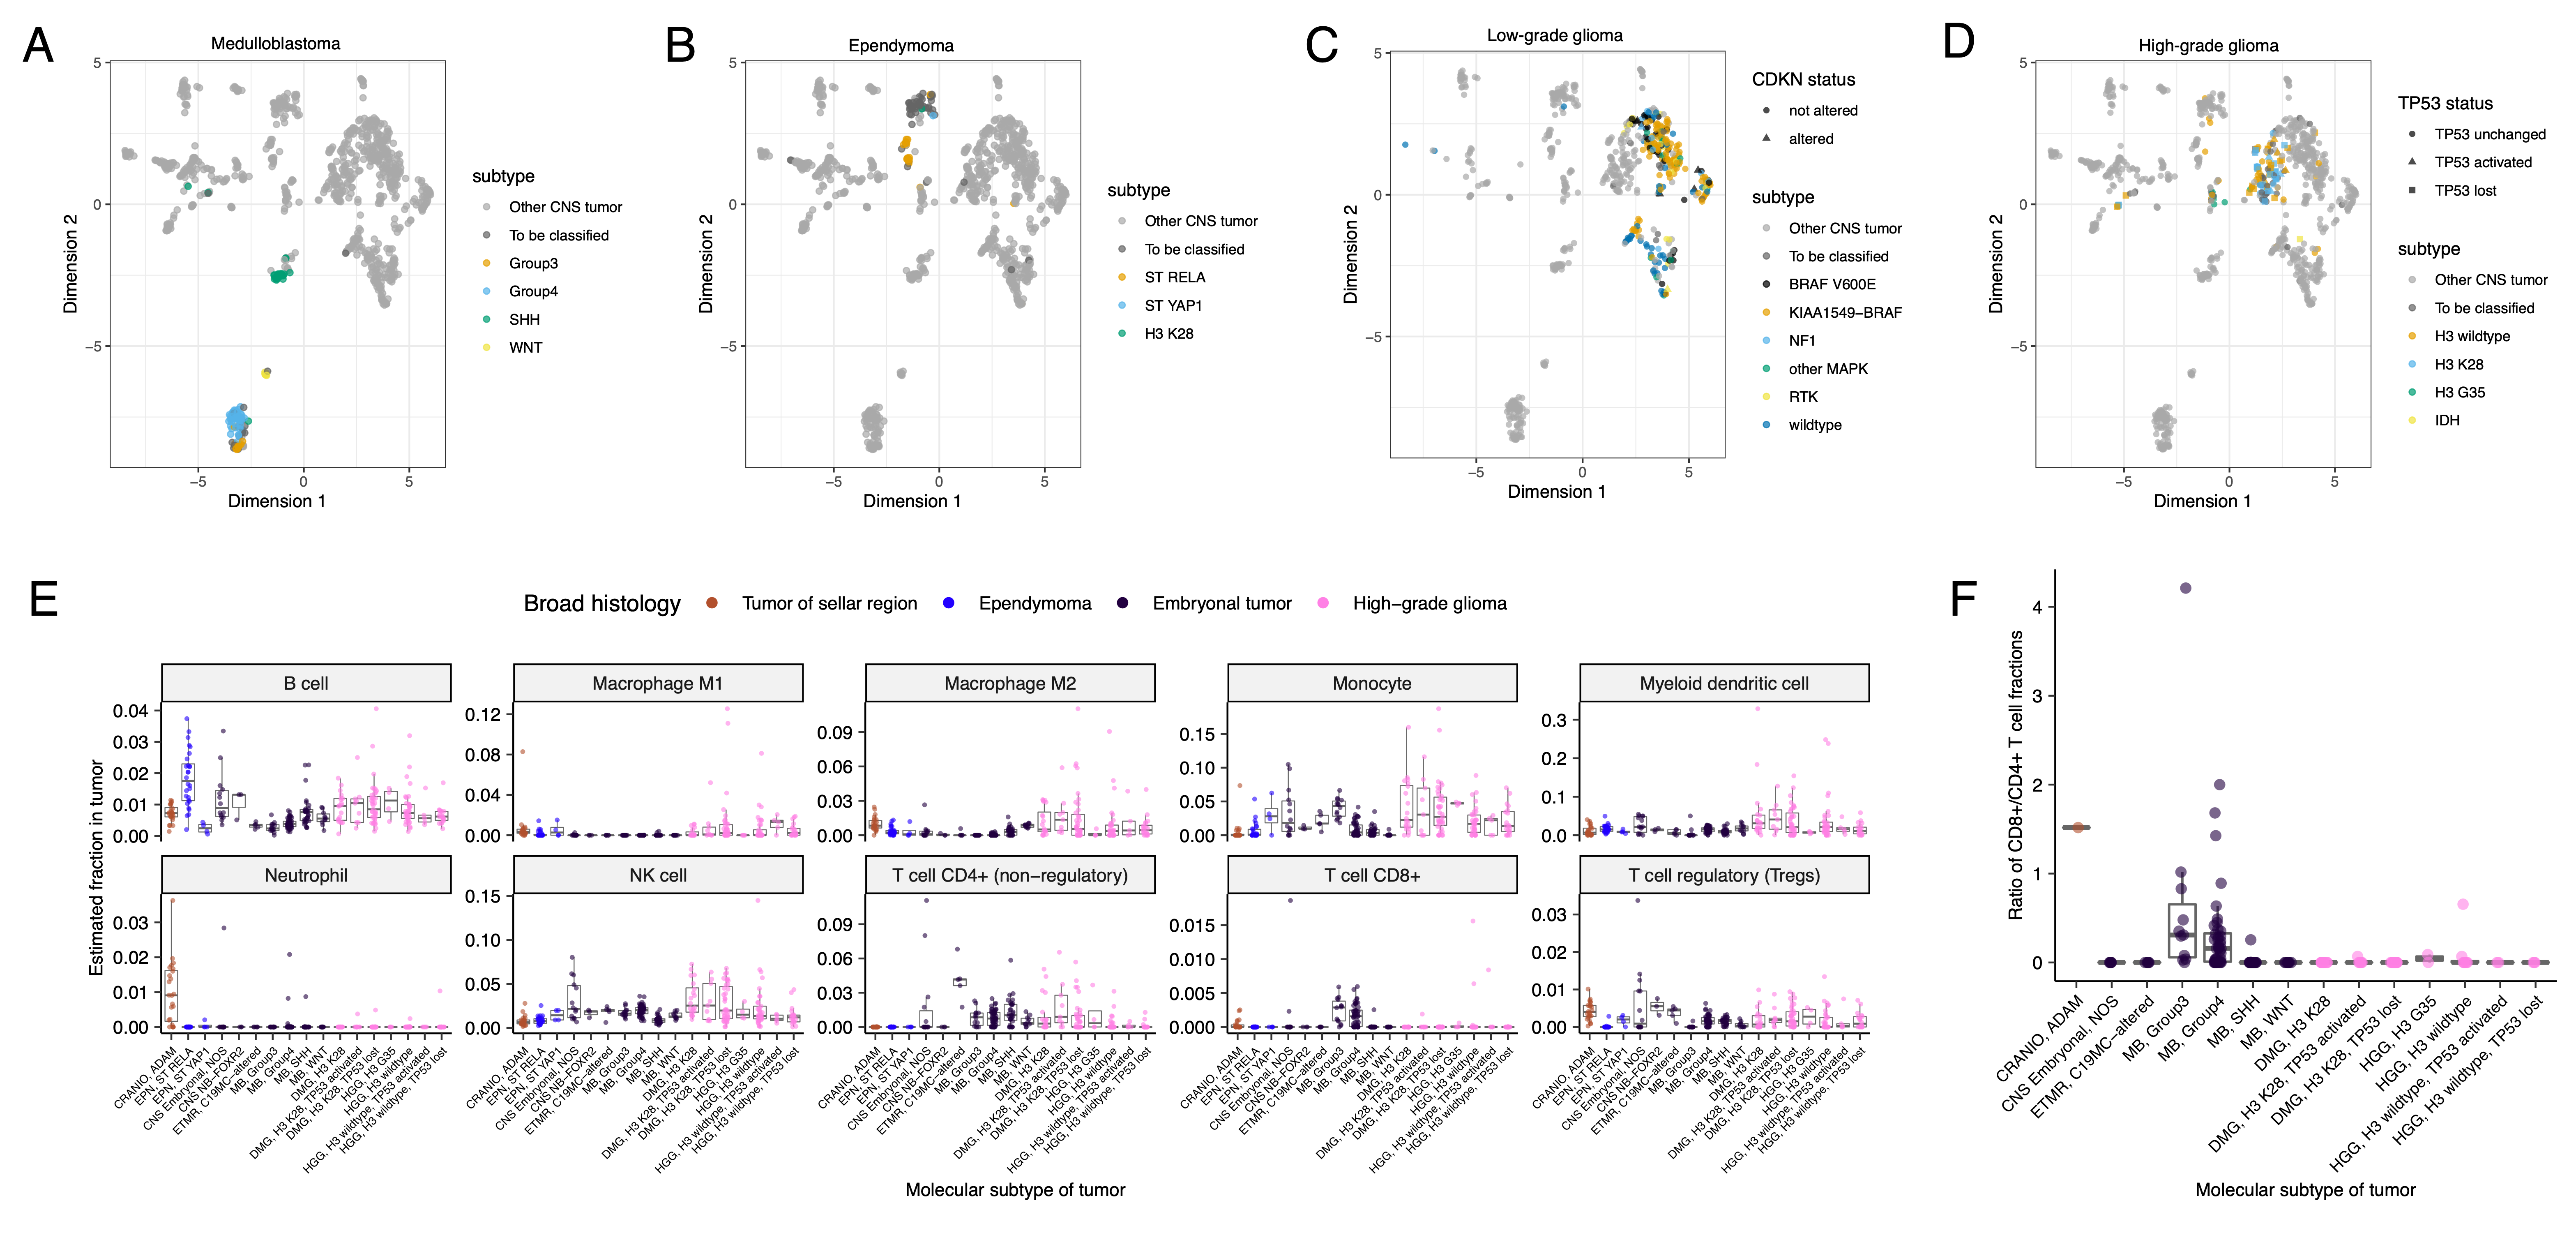
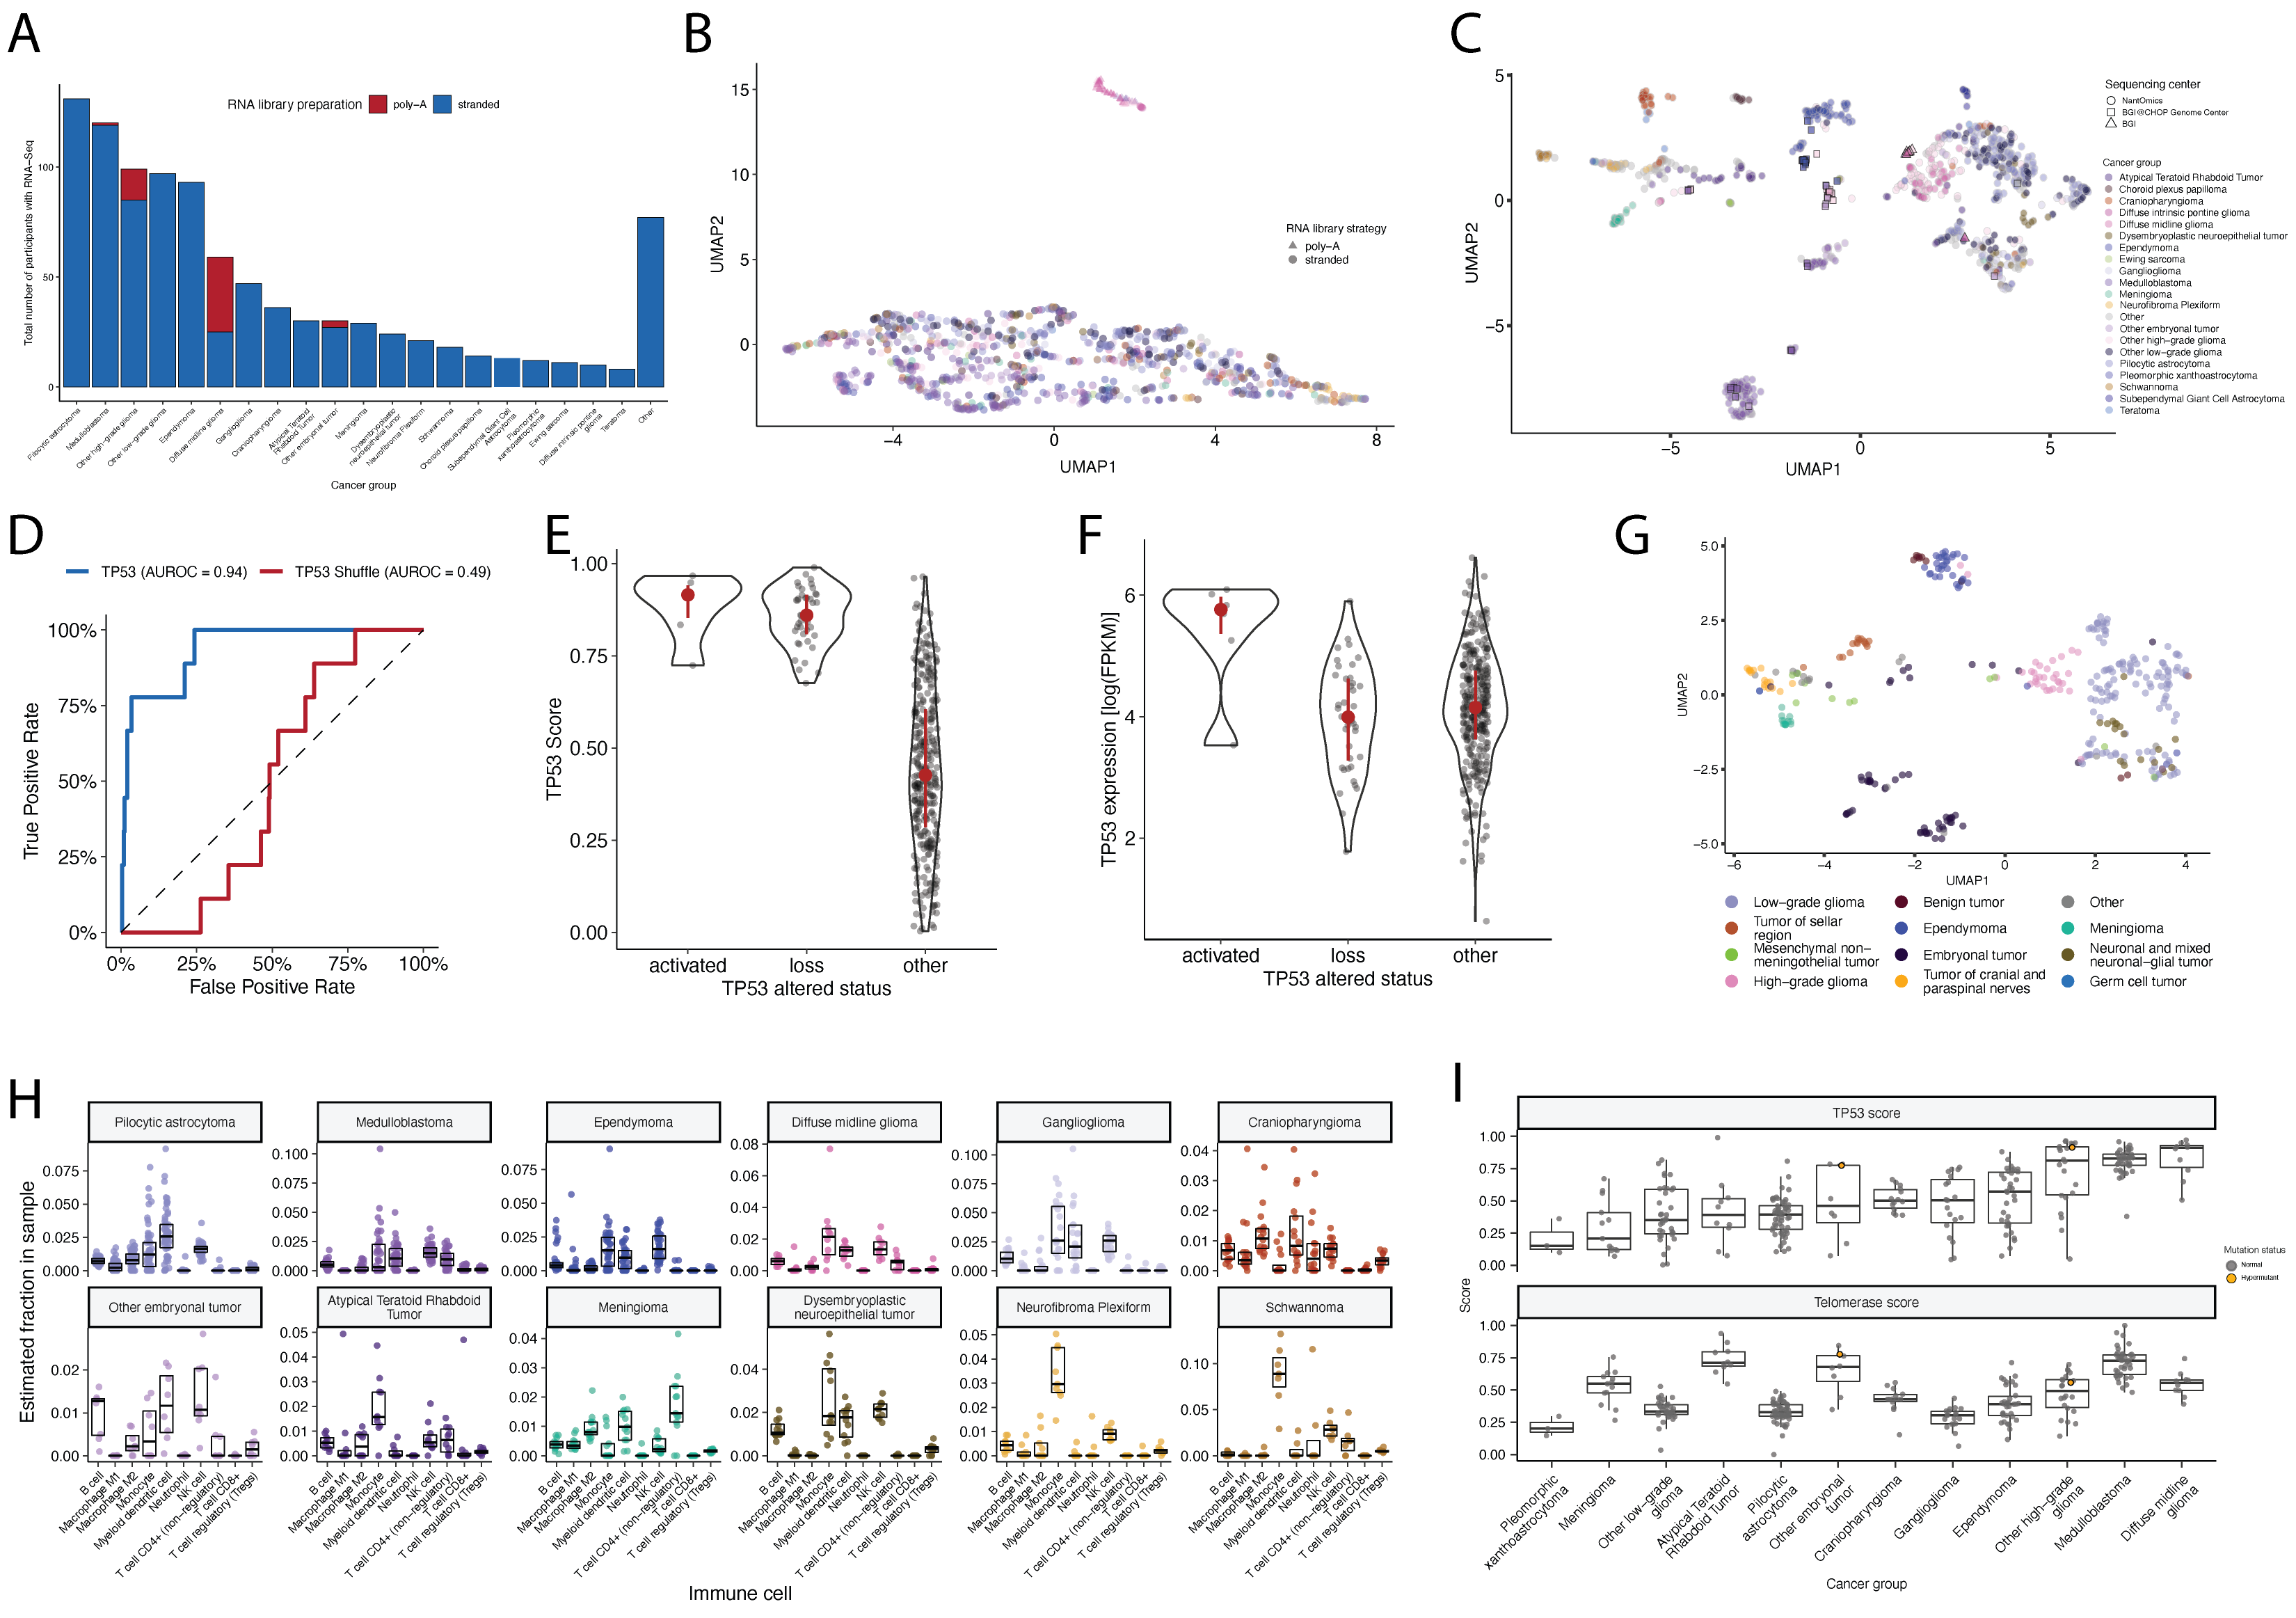
Table S3. Related to Figures 4 and 5. Excel file with three sheets representing tables of TP53 scores, telomerase EXTEND scores, and quanTIseq immune scores, respectively.
Table S4. Related to Figures 4 and 5. Excel file with six sheets representing the survival analyses performed for this manuscript. See Star Methods for details.
Table S5. Related to Figure 1. Excel file with four sheets representing of all software and their respective versions used for the OpenPBTA project, including the R packages in the OpenPBTA Docker image, Python packages i the OpenPBTA Docker image, other command line tools in the OpenPBTA Docker image, and all software used in the OpenPBTA workflows, respectively. Note that all software in the OpenPBTA Docker image was utilized within the analysis repository, but not all software was used for the final manuscript.