Technology used:
- HTML/CSS
- React(ES6)
- D3
- OpenWeather API
For a Live Demo visit http://www.vinodlouis.com/demos/world-weather/.
Data Source API : openweathermap.org/
Description about viz: An attempt to display weather data interctively on charts and maps.
Introduction :

1. This is a Demo of weather forecast for next 5 days on some time intervals for each day.
2. Initially the navigator asks for location, if you authorize it will lad weather for your current location else by default it will load of Pune.
3. Selected location is displayed on top. You can use the texbox to select any location of your choice later.
4. On the top right corner is a button to render Map. It gives an weather insights on interactive map.
Charts View :
Charts View :
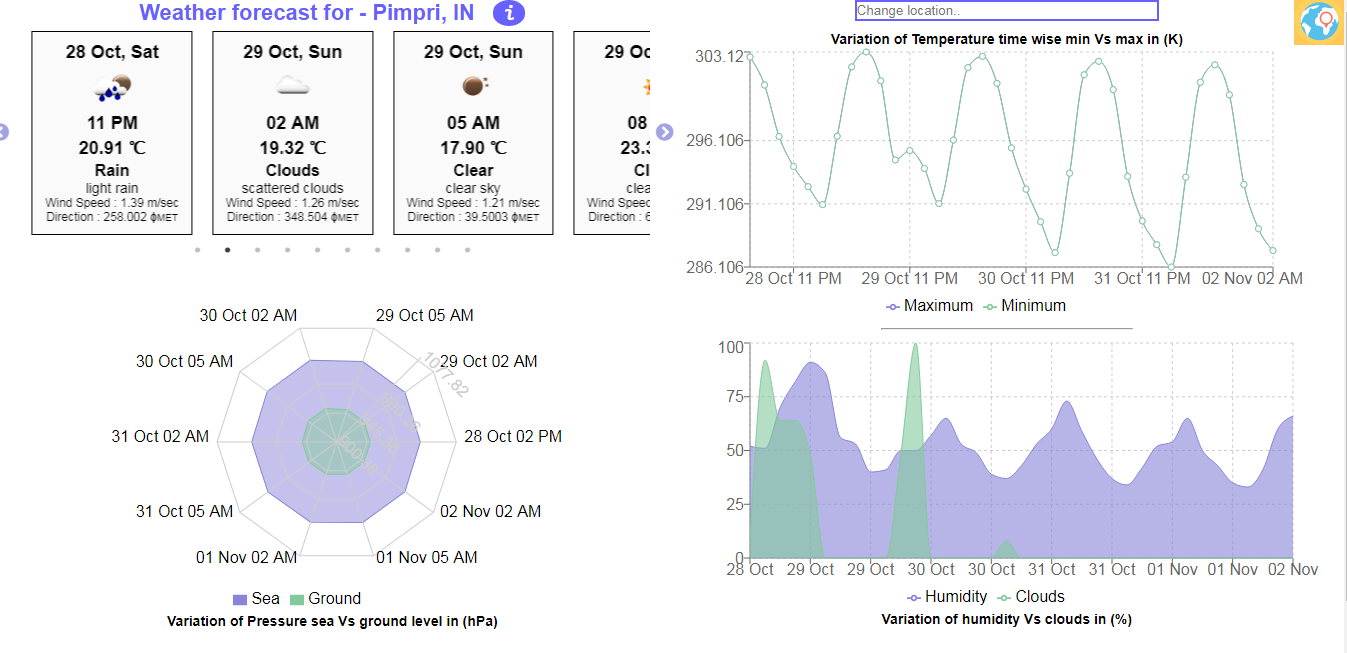
Carousel Widget :
It displays the weather data on time intervals in an carousel basic details such as time, temperature etc are displayed.
Line Chart :
It represents the Max Vs Min Temperature for different time intervals on each day, units are in Kelvin. Legends are interactive.
Spider Chart :
It represents the Sea Vs Ground Pressure for different time intervals on each day, units are in hPa.
Area Chart :
It represents the Humidity Vs Clouds for different time intervals on each day in Percentage(%).
Map View :
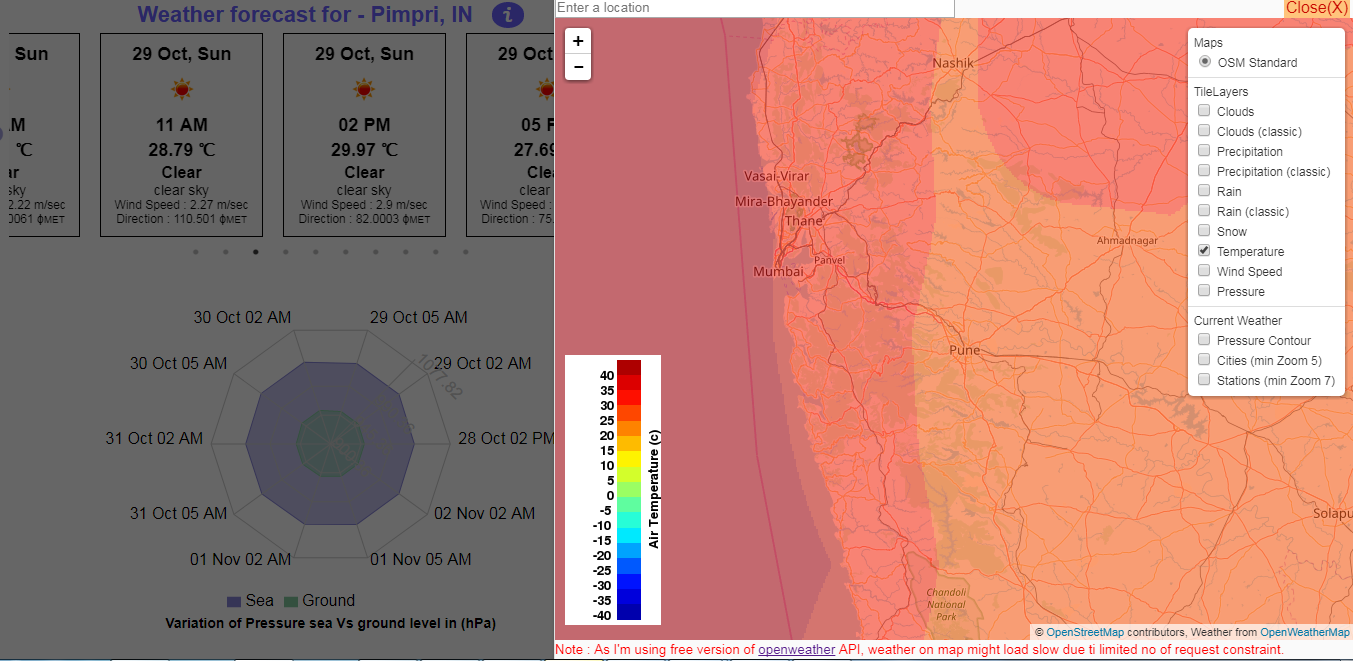
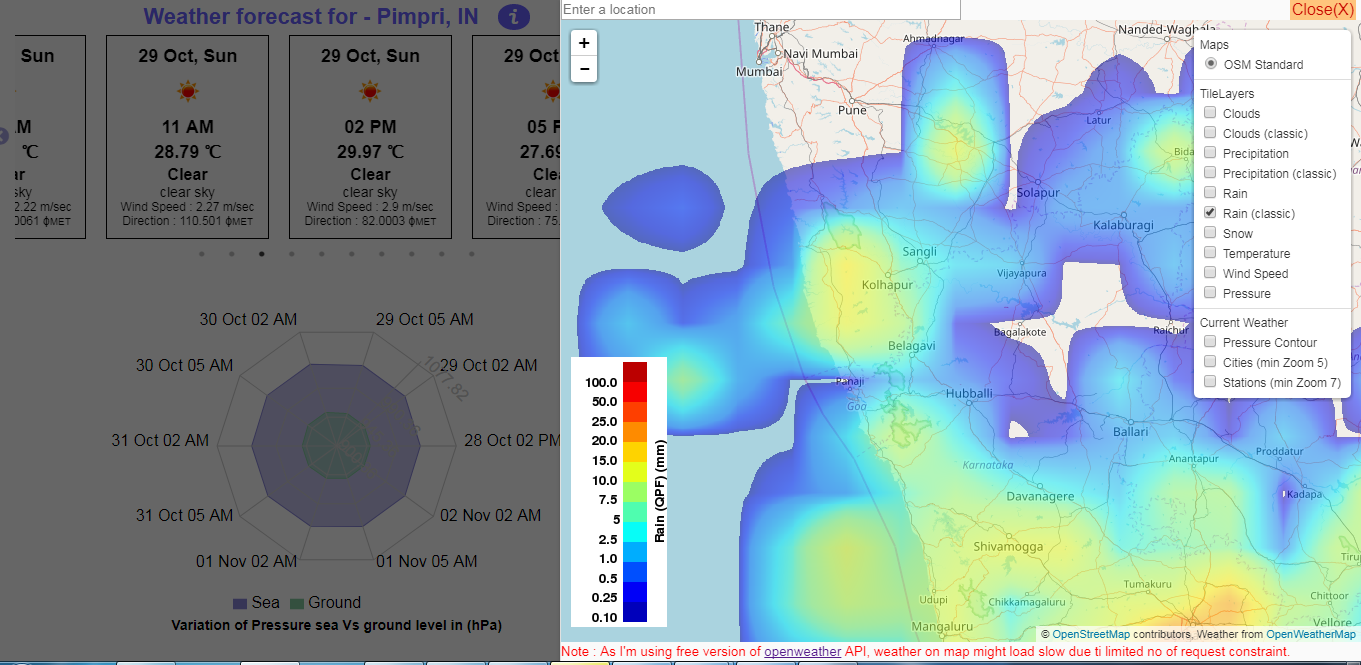
Map View :
A high level interactive weather interactive Component.
1. From the right side checkbox select the dimension you want to view
2. Tile Layers : Data converted to Tiles on map
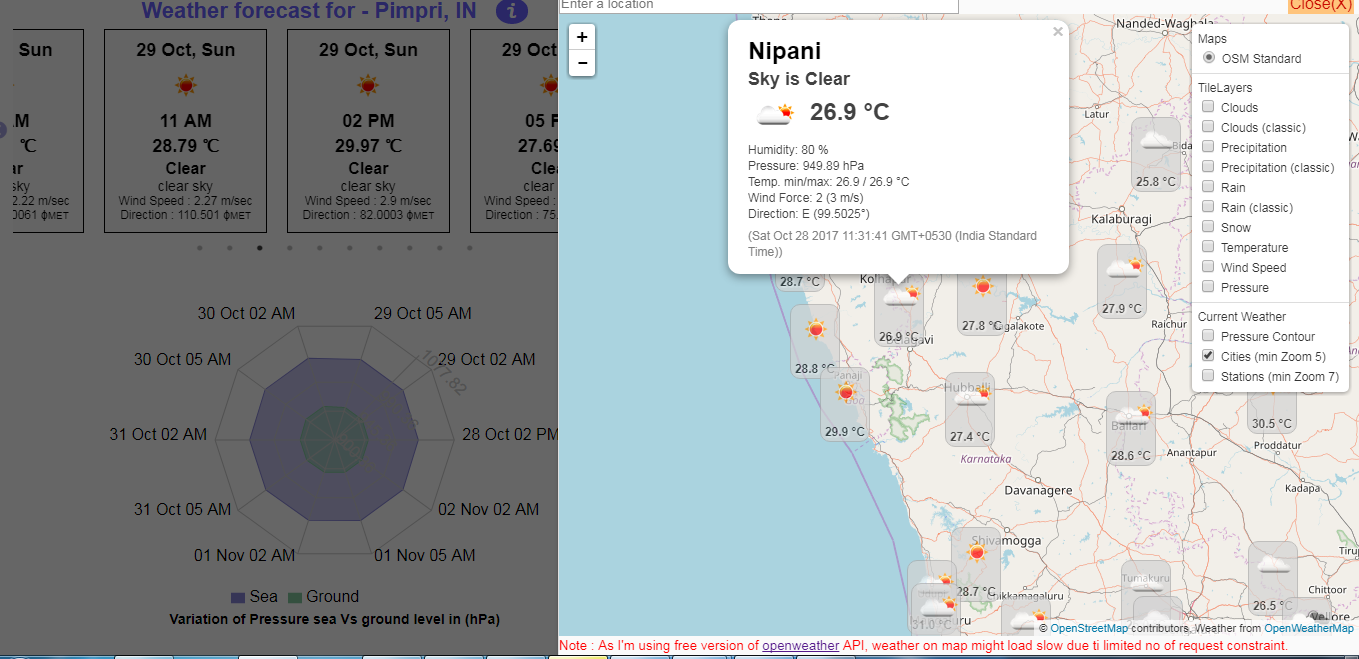
3. Current Weather : shows current weather on map based on cities, it also has a smal pop up to display details.
4. You can zoom drag map its interactive.
5. Moreover you can search locations from textbox also.