2.11.0 | GitHub | 2025-02-07 20:36:42 [UTC]
Common repository for example datasets used by Vega related projects. BSD-3-Clause license applies only to package code and infrastructure. Users should verify their use of datasets complies with the license terms of the original sources. Dataset license information, where included, is a reference starting point only and is provided without any warranty of accuracy or completeness.
| name | path | title |
|---|---|---|
| BSD-3-Clause | https://opensource.org/license/bsd-3-clause | The 3-Clause BSD License |
| title | path |
|---|---|
| UW Interactive Data Lab | http://idl.cs.washington.edu |
| vega-datasets contributors | https://github.com/vega/vega-datasets/graphs/contributors |
7zip.png
Application icon from open-source software project. Used in Image-based Scatter Plot example.
| title | path |
|---|---|
| 7-Zip | https://www.7-zip.org/ |
| title | path |
|---|---|
| GNU Lesser General Public License | https://www.7-zip.org/license.txt |
airports.csv
Airports in the United States and its territories, including major commercial, regional, and municipal airports. Contains information about each airport's location (latitude/longitude coordinates), identification codes, name, city, state, and country.
| name | type |
|---|---|
| iata | string |
| name | string |
| city | string |
| state | string |
| country | string |
| latitude | number |
| longitude | number |
| title | path |
|---|---|
| Airports (Data.gov) | https://catalog.data.gov/dataset/airports-5e97a |
| name | title |
|---|---|
| other-open | https://www.usa.gov/government-works |
annual-precip.json
A raster grid of global annual precipitation for the year 2016 at a resolution 1 degree of lon/lat per cell.
| title | path |
|---|---|
| Climate Forecast System Version 2 | https://www.cpc.ncep.noaa.gov/products/people/wwang/cfsv2_fcst_history/ |
| title | path |
|---|---|
| Public Domain | https://www.weather.gov/disclaimer/ |
anscombe.json
Eleven (x,y) pairs of numbers, with means x̄=9.0 and ȳ=7.5, and identical linear regression lines (same slope and intercept) and correlation coefficients (approximately 0.816). When plotted, reveals starkly different patterns: one shows a linear relationship, another a non-linear curve, the third a near-perfect linear relationship disrupted by a single outlier, and the fourth a near-vertical line of points where a single outlier entirely dictates the regression.
In his 1973 paper "Graphs in Statistical Analysis" Yale Professor Francis Anscombe uses these four datasets to argue that visualization is essential to good statistical work, not merely an optional supplement. This was a radical position at a time when most statistical analysis was done through batch processing on mainframes with no graphical output. Serves as a powerful demonstration that identical summary statistics can mask radically different patterns in data, making the case that statistical analysis should combine both numerical calculations and graphical examination.
| name | type |
|---|---|
| Series | string |
| X | integer |
| Y | number |
| title | path |
|---|---|
| Anscombe's quartet (Wikipedia) | https://en.wikipedia.org/wiki/Anscombe%27s_quartet#Data |
| Anscombe, F. J. (1973). Graphs in Statistical Analysis. The American Statistician, 27(1):17-21. | https://www.jstor.org/stable/2682899 |
barley.json
Yields of barley varieties from experiments conducted by the Minnesota Agricultural Experiment Station (MAES) across six sites in Minnesota. The USDA Technical Bulletin No. 735 (December 1940) republished these yields data with explicit credit to MAES as the source.
It was analyzed by agronomists F.R. Immer, H.K. Hayes, and L. Powers in the 1934 paper "Statistical Determination of Barley Varietal Adaption".
R.A. Fisher popularized its use in the field of statistics when he included it in his book "The Design of Experiments".
Since then it has been used to demonstrate new visualization techniques, including the trellis charts developed by Richard Becker, William Cleveland and others in the 1990s.
| name | type |
|---|---|
| yield | number |
| variety | string |
| year | integer |
| site | string |
| title | path |
|---|---|
| The Design of Experiments Reference | https://en.wikipedia.org/wiki/The_Design_of_Experiments |
| Wiebe, G. A., Reinbach-Welch, L., Cowan, P. R. (1940). Yields of Barley Varieties in the United States and Canada, 1932-36. United States: U.S. Department of Agriculture. | https://books.google.com/books?id=OUfxLocnpKkC&pg=PA19 |
| name |
|---|
| Dataset collected by Minnesota Agricultural Experiment Station - license status unspecified |
birdstrikes.csv
Records of reported wildlife strikes received by the U.S. FAA
| name | type |
|---|---|
| Airport Name | string |
| Aircraft Make Model | string |
| Effect Amount of damage | string |
| Flight Date | date |
| Aircraft Airline Operator | string |
| Origin State | string |
| Phase of flight | string |
| Wildlife Size | string |
| Wildlife Species | string |
| Time of day | string |
| Cost Other | integer |
| Cost Repair | integer |
| Cost Total $ | integer |
| Speed IAS in knots | integer |
| title | path |
|---|---|
| FAA Wildlife Strike Database | http://wildlife.faa.gov |
| title | path |
|---|---|
| U.S. Government Dataset | https://resources.data.gov/open-licenses/ |
budget.json
Historical and forecasted federal revenue/receipts produced in 2016 by the U.S. Office of Management and Budget.
| name | type |
|---|---|
| Source Category Code | integer |
| Source category name | string |
| Source subcategory | integer |
| Source subcategory name | string |
| Agency code | integer |
| Agency name | string |
| Bureau code | integer |
| Bureau name | string |
| Account code | integer |
| Account name | string |
| Treasury Agency code | integer |
| On- or off-budget | string |
| 1962 | string |
| 1963 | string |
| 1964 | string |
| 1965 | string |
| 1966 | string |
| 1967 | string |
| 1968 | string |
| 1969 | string |
| 1970 | string |
| 1971 | string |
| 1972 | string |
| 1973 | string |
| 1974 | string |
| 1975 | string |
| 1976 | string |
| TQ | string |
| 1977 | string |
| 1978 | string |
| 1979 | string |
| 1980 | string |
| 1981 | string |
| 1982 | string |
| 1983 | string |
| 1984 | string |
| 1985 | string |
| 1986 | string |
| 1987 | string |
| 1988 | string |
| 1989 | string |
| 1990 | string |
| 1991 | string |
| 1992 | string |
| 1993 | string |
| 1994 | string |
| 1995 | string |
| 1996 | string |
| 1997 | string |
| 1998 | string |
| 1999 | string |
| 2000 | string |
| 2001 | string |
| 2002 | string |
| 2003 | string |
| 2004 | string |
| 2005 | string |
| 2006 | string |
| 2007 | string |
| 2008 | string |
| 2009 | string |
| 2010 | string |
| 2011 | string |
| 2012 | string |
| 2013 | string |
| 2014 | string |
| 2015 | string |
| 2016 | string |
| 2017 | string |
| 2018 | string |
| 2019 | string |
| 2020 | string |
| title | path |
|---|---|
| Office of Management and Budget - Budget FY 2016 - Receipts | https://www.govinfo.gov/app/details/BUDGET-2016-DB/BUDGET-2016-DB-3 |
| title | path |
|---|---|
| U.S. Government Dataset | https://resources.data.gov/open-licenses/ |
budgets.json
U.S. federal budget projections and actual outcomes from 1980 through 2010. Originally analyzed by The New York Times in 2010. Reveals how budget forecasts made in any given year compared to what actually happened, with positive values indicating surpluses (briefly seen around 2000) and negative values representing deficits (reaching a particularly large value of -$1.78 trillion during the 2008-2009 financial crisis).
| name | type | description |
|---|---|---|
| budgetYear | integer | The year for which the budget outcome is being reported |
| forecastYear | integer | The year for which the budget was forecast |
| value | number | The budget outcome or projection value (in trillions of 2010 dollars) |
| title | path |
|---|---|
| Office of Management and Budget | https://www.whitehouse.gov/omb/ |
| title | path |
|---|---|
| U.S. Government Dataset | https://resources.data.gov/open-licenses/ |
burtin.json
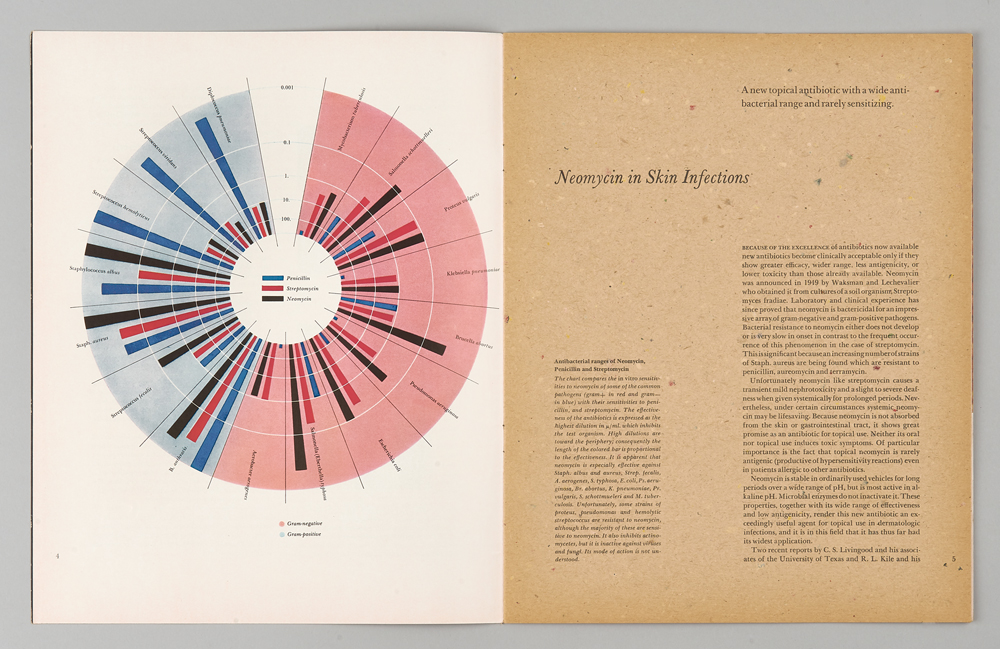
Compares the performance of three antibiotics against 16 different bacteria. Based on graphic designer Will Burtin's 1951 visualization of antibiotic effectiveness, originally published in Scope Magazine and featured as an example in the Protovis project, a precursor to D3.js.
Numerical values represent the minimum inhibitory concentration (MIC) of each antibiotic, measured in units per milliliter, with lower values indicating higher antibiotic effectiveness.
As noted in the Protovis example, "Recreating this display revealed some minor errors in the original: a missing grid line at 0.01 μg/ml, and an exaggeration of some values for penicillin".
The vega-datsets version is largely consistent with the Protovis version, with one correction (changing 'Brucella antracis' to the correct 'Bacillus anthracis') and the addition of a new column, 'Genus', to group related bacterial species together.
The caption of the original 1951 visualization reads as follows:
The chart compares the in vitro sensitivities to neomycin of some of the common pathogens (gram+ in red and gram- in blue) with their sensitivities to penicillin, and streptomycin.
The effectiveness of the antibiotics is expressed as the highest dilution in μ/ml. which inhibits the test organism.
High dilutions are toward the periphery; consequently the length of the colored bar is proportional to the effectiveness.
It is apparent that neomycin is especially effective against Staph. albus and aureus, Streph. fecalis, A. aerogenes, S. typhosa, E. coli, Ps. aeruginosa, Br. abortus, K. pneumoniae, Pr. vulgaris, S. schottmuelleri and M. tuberculosis.
Unfortunately, some strains of proteus, pseudomonas and hemolytic streptococcus are resistant to neomycin, although the majority of these are sensitive to neomycin.
It also inhibits actinomycetes, but is inactive against viruses and fungi. Its mode of action is not understood.
| name | type |
|---|---|
| Bacteria | string |
| Penicillin | number |
| Streptomycin | number |
| Neomycin | number |
| Gram_Staining | string |
| Genus | string |
| title | path |
|---|---|
| Scope Magazine | https://graphicdesignarchives.org/projects/scope-magazine-vol-iii-5/ |
| Protovis Antibiotics Example | https://mbostock.github.io/protovis/ex/antibiotics-burtin.html |
| title | path |
|---|---|
| BSD License (via Protovis) | https://mbostock.github.io/protovis/ |
cars.json
Collection of car specifications and performance metrics from various automobile manufacturers.
| name | type |
|---|---|
| Name | string |
| Miles_per_Gallon | integer |
| Cylinders | integer |
| Displacement | number |
| Horsepower | integer |
| Weight_in_lbs | integer |
| Acceleration | number |
| Year | date |
| Origin | string |
| title | path |
|---|---|
| StatLib Datasets Archive | http://lib.stat.cmu.edu/datasets/ |
| title | path |
|---|---|
| The original was distributed in 1982 for educational and scientific purposes. | http://lib.stat.cmu.edu/datasets/cars.desc |
co2-concentration.csv
Atmospheric CO2 concentration measurements from Mauna Loa Observatory, Hawaii. Contains monthly readings from 1958-2020 with two key measurements:
- CO2 concentrations in millionths of a mole of CO2 per mole of air (parts per million), reported on the 2012 SIO manometric mole fraction scale
- Seasonally adjusted values where a 4-harmonic fit with linear gain factor has been subtracted to remove the quasi-regular seasonal cycle Values are adjusted to 24:00 hours on the 15th of each month. Only includes rows with valid data.
| name | type |
|---|---|
| Date | date |
| CO2 | number |
| adjusted CO2 | number |
| title | path |
|---|---|
| Scripps CO2 Program | https://scrippsco2.ucsd.edu/data/atmospheric_co2/primary_mlo_co2_record |
| In-situ CO2 Data | https://scrippsco2.ucsd.edu/assets/data/atmospheric/stations/in_situ_co2/monthly/monthly_in_situ_co2_mlo.csv |
| title | path |
|---|---|
| Creative Commons Attribution 4.0 | https://creativecommons.org/licenses/by/4.0/ |
countries.json
Key demographic indicators (life expectancy at birth and fertility rate measured as babies per woman) for various countries from 1955 to 2000 at 5-year intervals. Includes both current values and adjacent time period values (previous and next) for each indicator. Gapminder's data documentation notes that its philosophy is to fill data gaps with estimates and use current geographic boundaries for historical data. Gapminder states that it aims to "show people the big picture" rather than support detailed numeric analysis.
| name | type | description |
|---|---|---|
| _comment | string | |
| year | integer | Years from 1955 to 2000 at 5-year intervals |
| fertility | number | Fertility rate (average number of children per woman) for the given year |
| life_expect | number | Life expectancy in years for the given year |
| n_fertility | number | Fertility rate for the next 5-year interval |
| n_life_expect | number | Life expectancy for the next 5-year interval |
| country | string | Name of the country |
| title | path | version |
|---|---|---|
| Gapminder Foundation - Life Expectancy | https://docs.google.com/spreadsheets/d/1RehxZjXd7_rG8v2pJYV6aY0J3LAsgUPDQnbY4dRdiSs/edit?gid=176703676#gid=176703676 | 14 |
| Gapminder Foundation - Fertility | https://docs.google.com/spreadsheets/d/1aLtIpAWvDGGa9k2XXEz6hZugWn0wCd5nmzaRPPjbYNA/edit?gid=176703676#gid=176703676 | 14 |
| title | path |
|---|---|
| Creative Commons Attribution 4.0 International | https://www.gapminder.org/free-material/ |
crimea.json
Monthly mortality rates from British military hospitals during the Crimean War (1854-1856), which informed Florence Nightingale's groundbreaking work in public health. Nightingale credits Dr. William Farr for compiling the data from the 1858 Medical and Surgical History of the British Army. Categorizes deaths into "zymotic" diseases (preventable infectious diseases), wounds/injuries, and other causes. Covering the period from April 1854 to March 1856, it includes monthly army strength alongside mortality figures. Transformed by Nightingale into her now-famous polar area diagrams.
The annual mortality rates plotted in the chart can be calculated using the formula
(Deaths × 1000 × 12) ÷ Army Size.
As The Lancet argued in 2020, Nightingale's innovative visualizations proved that "far more men died of disease, infection, and exposure than in battle—a fact that shocked the British nation." Her work also vividly illustrated the dramatic impact of sanitary reforms, particularly in reducing preventable deaths.
| name | type | description |
|---|---|---|
| date | date | First day of each month during the observation period, in ISO 8601 format (YYYY-MM-DD) |
| wounds | integer | Deaths from "Wounds and Injuries" which comprised: Luxatio (dislocation), Sub-Luxatio (partial dislocation), Vulnus Sclopitorum (gunshot wounds), Vulnus Incisum (incised wounds), Contusio (bruising), Fractura (fractures), Ambustio (burns) and Concussio-Cerebri (brain concussion) |
| other | integer | Deaths from All Other Causes |
| disease | integer | Deaths from Zymotic Diseases (preventable infectious diseases) |
| army_size | integer | Estimated Average Monthly Strength of the Army |
| title | path |
|---|---|
| Nightingale, Florence. A contribution to the sanitary history of the British army during the late war with Russia. London : John W. Parker and Son, 1859. Table II. Table showing the Estimated Average Monthly Strength of the Army; and the Deaths and Annual Rate of Mortality per 1,000 in each month, from April 1854, to March 1856 (inclusive), in the Hospitals of the Army in the East. | https://nrs.lib.harvard.edu/urn-3:hms.count:1177146?n=21 |
| title | path |
|---|---|
| Harvard Library - Digitized Content Copyright & Viewer Terms of Use | https://library.harvard.edu/privacy-terms-use-copyright-information#digitizedcontent |
disasters.csv
Annual number of deaths from disasters, sourced from EM-DAT (Emergency Events Database) maintained by the Centre for Research on the Epidemiology of Disasters (CRED) at UCLouvain, Belgium. Processed by Our World in Data to standardize country names and world region definitions, converting units, calculating derived indicators, and adapting metadata. Deaths are reported as absolute numbers.
| name | type |
|---|---|
| Entity | string |
| Year | integer |
| Deaths | integer |
| title | path |
|---|---|
| EM-DAT: The Emergency Events Database | https://www.emdat.be |
| Hannah Ritchie, Pablo Rosado and Max Roser (2022) - Natural Disasters | https://ourworldindata.org/natural-catastrophes |
| title | path |
|---|---|
| EM-DAT terms of use | https://doc.emdat.be/docs/legal/terms-of-use/ |
| Creative Commons BY license (Our World in Data) | https://creativecommons.org/licenses/by/4.0/ |
driving.json
Tracks the relationship between driving habits and gasoline prices in the United States during a period spanning multiple significant events, including the cheap gas era, Arab oil embargo, energy crisis, record low prices, and the "swing backward" from 1956 to 2010.
| name | type | description | categories |
|---|---|---|---|
| side | string | Label positioning indicator used in the original visualization to optimize | ['left', 'right', 'top', 'bottom'] |
| readability and prevent overlap | |||
| year | integer | Year of observation from 1956 to 2010 | |
| miles | integer | Miles driven per capita per year, ranging from approximately 4,000 to 10,000 miles | |
| gas | number | Price of a gallon of regular grade gasoline, adjusted for inflation |
| title | path |
|---|---|
| New York Times (citing U.S. Energy Information Administration, Federal Highway Administration, and Brookings Institution) | https://archive.nytimes.com/www.nytimes.com/imagepages/2010/05/02/business/02metrics.html |
earthquakes.json
Represents approximately one week of continuous monitoring from USGS's "all earthquakes" real-time feed, which includes 1,703 seismic events of all magnitudes recorded by the USGS Earthquake Hazards Program from January 31 to February 7, 2018 (UTC).
| title | path |
|---|---|
| USGS Earthquake Feed | https://earthquake.usgs.gov/earthquakes/feed/v1.0/summary/all_week.geojson |
| title | path |
|---|---|
| U.S. Public Domain | https://www.usgs.gov/information-policies-and-instructions/copyrights-and-credits |
ffox.png
Application icon from open-source software project. Used in Image-based Scatter Plot example.
| title | path |
|---|---|
| Mozilla Firefox | https://www.mozilla.org/firefox/ |
| title | path |
|---|---|
| Mozilla Trademark License | https://www.mozilla.org/en-US/foundation/trademarks/policy/ |
flare-dependencies.json
Indicates, with flare.json, relationships among classes in a software hierarchy.
| name | type |
|---|---|
| source | integer |
| target | integer |
flare.json
Indicates, with flare-dependencies.json, relationships among classes in a software hierarchy.
| name | type |
|---|---|
| id | integer |
| name | string |
flights-10k.json
Flight delay statistics (10,000 rows) from U.S. Bureau of Transportation Statistics.
Collected under regulatory reporting requirements (14 CFR Part 234), which mandate
that qualifying airlines report on-time performance data to BTS. Transformed using
/scripts/flights.py
| name | type |
|---|---|
| date | string |
| delay | integer |
| distance | integer |
| origin | string |
| destination | string |
| title | path |
|---|---|
| U.S. Bureau of Transportation Statistics | https://www.transtats.bts.gov/DL_SelectFields.asp?gnoyr_VQ=FGJ&QO_fu146_anzr=b0-gvzr |
| name | path | title |
|---|---|---|
| other-open | https://www.ecfr.gov/current/title-14/chapter-II/subchapter-A/part-234 | Data Collected Under U.S. DOT Regulatory Requirements - License Terms Not Explicitly Specified |
flights-200k.arrow
Flight delay statistics (200,000 rows) from U.S. Bureau of Transportation Statistics.
Collected under regulatory reporting requirements (14 CFR Part 234), which mandate
that qualifying airlines report on-time performance data to BTS. Transformed using
/scripts/flights.py
| name | type |
|---|---|
| delay | integer |
| distance | integer |
| time | number |
| title | path |
|---|---|
| U.S. Bureau of Transportation Statistics | https://www.transtats.bts.gov/DL_SelectFields.asp?gnoyr_VQ=FGJ&QO_fu146_anzr=b0-gvzr |
| name | path | title |
|---|---|---|
| other-open | https://www.ecfr.gov/current/title-14/chapter-II/subchapter-A/part-234 | Data Collected Under U.S. DOT Regulatory Requirements - License Terms Not Explicitly Specified |
flights-200k.json
Flight delay statistics (200,000 rows) from U.S. Bureau of Transportation Statistics.
Collected under regulatory reporting requirements (14 CFR Part 234), which mandate
that qualifying airlines report on-time performance data to BTS. Transformed using
/scripts/flights.py
| name | type |
|---|---|
| delay | integer |
| distance | integer |
| time | number |
| title | path |
|---|---|
| U.S. Bureau of Transportation Statistics | https://www.transtats.bts.gov/DL_SelectFields.asp?gnoyr_VQ=FGJ&QO_fu146_anzr=b0-gvzr |
| name | path | title |
|---|---|---|
| other-open | https://www.ecfr.gov/current/title-14/chapter-II/subchapter-A/part-234 | Data Collected Under U.S. DOT Regulatory Requirements - License Terms Not Explicitly Specified |
flights-20k.json
Flight delay statistics (20,000 rows) from U.S. Bureau of Transportation Statistics.
Collected under regulatory reporting requirements (14 CFR Part 234), which mandate
that qualifying airlines report on-time performance data to BTS. Transformed using
/scripts/flights.py
| name | type |
|---|---|
| date | string |
| delay | integer |
| distance | integer |
| origin | string |
| destination | string |
| title | path |
|---|---|
| U.S. Bureau of Transportation Statistics | https://www.transtats.bts.gov/DL_SelectFields.asp?gnoyr_VQ=FGJ&QO_fu146_anzr=b0-gvzr |
| name | path | title |
|---|---|---|
| other-open | https://www.ecfr.gov/current/title-14/chapter-II/subchapter-A/part-234 | Data Collected Under DOT Regulatory Requirements - License Terms Not Explicitly Specified |
flights-2k.json
Flight delay statistics (2,000 rows) from U.S. Bureau of Transportation Statistics.
Collected under regulatory reporting requirements (14 CFR Part 234), which mandate
that qualifying airlines report on-time performance data to BTS. Transformed using
/scripts/flights.py
| name | type |
|---|---|
| date | string |
| delay | integer |
| distance | integer |
| origin | string |
| destination | string |
| title | path |
|---|---|
| U.S. Bureau of Transportation Statistics | https://www.transtats.bts.gov/DL_SelectFields.asp?gnoyr_VQ=FGJ&QO_fu146_anzr=b0-gvzr |
| name | path | title |
|---|---|---|
| other-open | https://www.ecfr.gov/current/title-14/chapter-II/subchapter-A/part-234 | Data Collected Under U.S. DOT Regulatory Requirements - License Terms Not Explicitly Specified |
flights-3m.parquet
Flight delay statistics (3 million rows) from U.S. Bureau of Transportation Statistics.
Collected under regulatory reporting requirements (14 CFR Part 234), which mandate
that qualifying airlines report on-time performance data to BTS. Transformed using
/scripts/flights.py
| name | type |
|---|---|
| date | datetime |
| delay | integer |
| distance | integer |
| origin | string |
| destination | string |
| title | path |
|---|---|
| U.S. Bureau of Transportation Statistics | https://www.transtats.bts.gov/DL_SelectFields.asp?gnoyr_VQ=FGJ&QO_fu146_anzr=b0-gvzr |
| name | path | title |
|---|---|---|
| other-open | https://www.ecfr.gov/current/title-14/chapter-II/subchapter-A/part-234 | Data Collected Under U.S. DOT Regulatory Requirements - License Terms Not Explicitly Specified |
flights-5k.json
Flight delay statistics (5,000 rows) from U.S. Bureau of Transportation Statistics.
Collected under regulatory reporting requirements (14 CFR Part 234), which mandate
that qualifying airlines report on-time performance data to BTS. Transformed using
/scripts/flights.py
| name | type |
|---|---|
| date | string |
| delay | integer |
| distance | integer |
| origin | string |
| destination | string |
| title | path |
|---|---|
| U.S. Bureau of Transportation Statistics | https://www.transtats.bts.gov/DL_SelectFields.asp?gnoyr_VQ=FGJ&QO_fu146_anzr=b0-gvzr |
| name | path | title |
|---|---|---|
| other-open | https://www.ecfr.gov/current/title-14/chapter-II/subchapter-A/part-234 | Data Collected Under U.S. DOT Regulatory Requirements - License Terms Not Explicitly Specified |
flights-airport.csv
Flight information for the year 2008. Each record consists of an origin airport (identified by IATA id), a destination airport, and the count of flights along this route.
| name | type |
|---|---|
| origin | string |
| destination | string |
| count | integer |
| title | path |
|---|---|
| U.S. Bureau of Transportation Statistics | |
| U.S. Bureau of Transportation Statistics | https://www.transtats.bts.gov/DL_SelectFields.asp?gnoyr_VQ=FGJ&QO_fu146_anzr=b0-gvzr |
| title | path |
|---|---|
| U.S. Government Dataset | https://www.usa.gov/government-works |
football.json
Football match outcomes across multiple divisions from 2013 to 2017, part of a larger dataset from OpenFootball. The subset was made such that there are records for all five chosen divisions over the time period.
| name | type |
|---|---|
| date | date |
| division | string |
| home_team | string |
| away_team | string |
| home_score | integer |
| away_score | integer |
| title | path |
|---|---|
| OpenFootball | https://github.com/openfootball/football.json |
| path |
|---|
| https://github.com/openfootball/football.json?tab=readme-ov-file#license |
gapminder-health-income.csv
Per-capita income, life expectancy, population and regional grouping. Reference year for the data is not specified. Gapminder historical data is subject to revisions.
Gapminder (v30, 2023) defines per-capita income as follows:
"This is real GDP per capita (gross domestic product per person adjusted for inflation) converted to international dollars using purchasing power parity rates. An international dollar has the same purchasing power over GDP as the U.S. dollar has in the United States."
| name | type |
|---|---|
| country | string |
| income | integer |
| health | number |
| population | integer |
| region | string |
| title | path |
|---|---|
| Gapminder Foundation | https://www.gapminder.org |
| Gapminder GDP Per Capita Data | https://docs.google.com/spreadsheets/d/1i5AEui3WZNZqh7MQ4AKkJuCz4rRxGR_pw_9gtbcBOqQ/edit?gid=501532268#gid=501532268 |
| title | path |
|---|---|
| Creative Commons Attribution 4.0 International | https://www.gapminder.org/free-material/ |
gapminder.json
Combines key demographic indicators (life expectancy at birth, population, and fertility rate measured as babies per woman) for various countries from 1955 to 2005 at 5-year intervals. Includes a 'cluster' column, a categorical variable grouping countries. Gapminder's data documentation notes that its philosophy is to fill data gaps with estimates and use current geographic boundaries for historical data. Gapminder states that it aims to "show people the big picture" rather than support detailed numeric analysis.
Notes:
-
Country Selection: The set of countries matches the version of this dataset originally added to this collection in 2015. The specific criteria for country selection in that version are not known. Data for Aruba are no longer available in the new version. Hong Kong has been revised to Hong Kong, China in the new version.
-
Data Precision: The precision of float values may have changed from the original version. These changes reflect the most recent source data used for each indicator.
-
Regional Groupings: To preserve continuity with previous versions of this dataset, we have retained the column name 'cluster' instead of renaming it to 'six_regions'.
| name | type | description | categories |
|---|---|---|---|
| year | integer | Years from 1955 to 2005 at 5-year intervals | |
| country | string | Name of the country | |
| cluster | integer | A categorical variable grouping countries by region | [{'value': 0, 'label': 'south_asia'}, {'value': 1, 'label': 'europe_central_asia'}, {'value': 2, 'label': 'sub_saharan_africa'}, {'value': 3, 'label': 'america'}, {'value': 4, 'label': 'east_asia_pacific'}, {'value': 5, 'label': 'middle_east_north_africa'}] |
| pop | integer | Population of the country | |
| life_expect | number | Life expectancy in years | |
| fertility | number | Fertility rate (average number of children per woman |
| title | path |
|---|---|
| Creative Commons Attribution 4.0 International | https://www.gapminder.org/free-material/ |
gimp.png
Application icon from open-source software project. Used in Image-based Scatter Plot example.
| title | path |
|---|---|
| GIMP - About GIMP | https://www.gimp.org/about/ |
| path |
|---|
| https://www.gimp.org/docs/userfaq.html#whats-the-gimps-license-and-how-do-i-comply-with-it |
github.csv
Simulated GitHub contribution data showing hourly commit counts across different times of day. Designed to demonstrate typical patterns of developer activity in a GitHub-style punchcard visualization format.
| name | type | description |
|---|---|---|
| time | string | Hourly timestamp from January 1st to May 30th, 2015 |
| count | integer | Simulated hourly commit counts |
| title |
|---|
Generated using /scripts/github.py. |
| path |
|---|
| https://github.com/vega/vega-datasets/blob/main/scripts/LICENSE |
global-temp.csv
Combined Land-Surface Air and Sea-Surface Water Temperature Anomalies (Land-Ocean Temperature Index, L-OTI), 1880-2023.
| name | type |
|---|---|
| year | integer |
| temp | number |
| title | path |
|---|---|
| NASA Goddard Institute for Space Studies | https://data.giss.nasa.gov/gistemp/ |
| title | path |
|---|---|
| U.S. Government Dataset | https://www.usa.gov/government-works |
income.json
Household income distribution by US state, derived from the
Census Bureau's American Community Survey 3-Year Data (2013). The dataset
shows the percentage of households within different income brackets for each state.
Generated using /scripts/income.py. This product uses the Census Bureau Data API
but is not endorsed or certified by the Census Bureau.
| name | type |
|---|---|
| name | string |
| region | string |
| id | integer |
| pct | number |
| total | integer |
| group | string |
| title | path |
|---|---|
| U.S. Census Bureau American Community Survey 3-Year Data (2013) | https://www.census.gov/data/developers/data-sets/acs-3year/2013.html |
| Census Bureau Data API User Guide | https://www.census.gov/data/developers/guidance/api-user-guide.html |
| title | path | name |
|---|---|---|
| U.S. Census Bureau API Terms of Service | https://www.census.gov/data/developers/about/terms-of-service.html | Census Bureau Terms of Use |
iowa-electricity.csv
Annual net generation of electricity in Iowa by source, in thousand megawatthours. U.S. EIA data downloaded on May 6, 2018. Useful for illustrating stacked area charts. Demonstrates dramatic increase in wind power production.
| name | type |
|---|---|
| year | date |
| source | string |
| net_generation | integer |
| title | path |
|---|---|
| U.S. Government Dataset | https://www.usa.gov/government-works |
jobs.json
U.S. census data on occupations by sex and year across decades between 1850 and 2000. Obtained from IPUMS USA, which "collects, preserves and harmonizes U.S. census microdata" from as early as 1790.
Originally created for a 2006 data visualization project called sense.us by IBM Research (Jeff Heer, Martin Wattenberg and Fernanda Viégas), described here. The dataset is also referenced in this vega example.
Based on a tabulation of the OCC1950 variable by sex across IPUMS USA samples. Appears to be derived from Version 6.0 (2015) of IPUMS USA, according to 2024 correspondence with the IPUMS Project. IPUMS has made improvements to occupation coding since version 6, particularly for 19th-century samples, which may result in discrepancies between this dataset and current IPUMS data. Details on data revisions are available here.
IPUMS USA confirmed in 2024 correspondence that hosting this dataset on vega-datasets is permissible, stating:
We're excited to hear that this dataset made its way to this repository and is being used by students for data visualization. We allow for these types of redistributions of summary data so long as the underlying microdata records are not shared.
- Represents summary data. Underlying microdata records are not included.
- Users attempting to replicate or extend this data should use the PERWT (person weight) variable as an expansion factor when working with IPUMS USA extracts.
- Due to coding revisions, figures for earlier years (particularly 19th century) may not match current IPUMS USA data exactly.
When using this dataset, please refer to IPUMS USA terms of use. The organization requests use of the following citation for this json file:
Steven Ruggles, Katie Genadek, Ronald Goeken, Josiah Grover, and Matthew Sobek. Integrated Public Use Microdata Series: Version 6.0. Minneapolis: University of Minnesota, 2015. http://doi.org/10.18128/D010.V6.0
| name | type | description |
|---|---|---|
| job | string | The occupation title |
| sex | string | Sex (men/women) |
| year | integer | Census year |
| count | integer | Number of individuals in the occupation |
| perc | number | Percentage of the workforce in the occupation |
| title | path | version |
|---|---|---|
| IPUMS USA | https://usa.ipums.org/usa/ | 6 |
| title | path |
|---|---|
| IPUMS Terms of Use | https://www.ipums.org/about/terms |
la-riots.csv
A comprehensive record of fatalities during the five days of civil unrest in Los Angeles beginning April 29, 1992, documenting over 60 deaths with associated geographic coordinates where each person lost their life. Originally compiled and published by the Los Angeles Times Data Desk.
| name | type |
|---|---|
| first_name | string |
| last_name | string |
| age | integer |
| gender | string |
| race | string |
| death_date | date |
| address | string |
| neighborhood | string |
| type | string |
| longitude | number |
| latitude | number |
| title | path |
|---|---|
| LA Riots Deaths, Los Angeles Times Data Desk | http://spreadsheets.latimes.com/la-riots-deaths/ |
londonBoroughs.json
Boundaries of London boroughs reprojected and simplified from London_Borough_Excluding_MHW shapefile.
Original data "contains National Statistics data © Crown copyright and database right (2015)"
and "Contains Ordnance Survey data © Crown copyright and database right [2015].
| title | path |
|---|---|
| Statistical GIS Boundary Files, London Datastore | https://data.london.gov.uk/dataset/statistical-gis-boundary-files-london |
| title | path |
|---|---|
| UK Open Government License | https://www.nationalarchives.gov.uk/doc/open-government-licence/version/3/ |
londonCentroids.json
Calculated from londonBoroughs.json using d3.geoCentroid.
| name | type |
|---|---|
| name | string |
| cx | number |
| cy | number |
| title | path |
|---|---|
| londonBoroughs.json from the vega-datasets repository | https://github.com/vega/vega-datasets/blob/main/data/londonBoroughs.json |
| title | path |
|---|---|
| UK Open Government License | https://www.nationalarchives.gov.uk/doc/open-government-licence/version/3/ |
londonTubeLines.json
A topologically-encoded representation of select London Underground rail lines, derived from OpenStreetMap
data. These 394 LineString geometries, encoded using 406 arcs, depict transport paths between stations with stations marked as nodes
along the lines. Originally transformed from a GeoJSON intermediary tfl_lines.json into TopoJSON format, this network configuration
reflects the system as of February 4, 2018, and may not incorporate subsequent modifications or expansions.
| title | path |
|---|---|
| OpenStreetMap Data (processed by oobrien/vis) | https://github.com/oobrien/vis/blob/master/tubecreature/data/tfl_lines.json |
| title | path |
|---|---|
| Open Data Commons Open Database License (ODbL) | https://opendatacommons.org/licenses/odbl/ |
lookup_groups.csv
A nine-row lookup table for the lookup_people.csv dataset,
mapping people to groups. Used to demonstrate lookup transforms.
| name | type |
|---|---|
| group | integer |
| person | string |
| title |
|---|
| Generated Data |
| path |
|---|
| https://github.com/vega/vega-datasets/blob/main/scripts/LICENSE |
lookup_people.csv
A synthetic list of nine people and their associated name, age,
and height in centimeters. Used in conjunction with lookup_groups.csv
to demonstrate lookup transforms.
| name | type |
|---|---|
| name | string |
| age | integer |
| height | integer |
| title |
|---|
| Generated Data |
| path |
|---|
| https://github.com/vega/vega-datasets/blob/main/scripts/LICENSE |
miserables.json
A weighted network of coappearances of characters in Victor Hugo's novel "Les Miserables". Nodes represent characters as indicated by the labels and edges connect any pair of characters that appear in the same chapter of the book. The values on the edges are the number of such coappearances.
| title | path |
|---|---|
| D. E. Knuth, The Stanford GraphBase: A Platform for Combinatorial Computing, Addison-Wesley, Reading, MA (1993). | https://www-cs-faculty.stanford.edu/~knuth/sgb.html |
| path |
|---|
| https://websites.umich.edu/~mejn/netdata/ |
monarchs.json
A chronological list of English and British monarchs from Elizabeth I through George IV.
Contains two intentional inaccuracies to maintain compatibility with the Wheat and Wages example visualization:
- the start date for the reign of Elizabeth I is shown as 1565, instead of 1558;
- the end date for the reign of George IV is shown as 1820, instead of 1830.
These discrepancies align the
monarchs.jsondataset with the start and end dates of thewheat.jsondataset used in the visualization. The entry "W&M" represents the joint reign of William III and Mary II. While the dataset shows their reign as 1689-1702, the official Web site of the British royal family indicates that Mary II's reign ended in 1694, though William III continued to rule until 1702. Thecommonwealthfield is used to flag the period from 1649 to 1660, which includes the Commonwealth of England, the Protectorate, and the period leading to the Restoration. While historically more accurate to call this the "interregnum," the field name ofcommonwealthfrom the original dataset is retained for backwards compatibility.
Important
Revised in Aug. 2024 to show James II's reign now ends in 1688 (previously 1689).
Source data has been verified against the kings & queens and interregnum pages of the official website of the British royal family (retrieved in Aug. 2024).
| name | type | description |
|---|---|---|
| name | string | The ruler's name or identifier (e.g., "W&M" for William and Mary, "Cromwell" for the period of interregnum) |
| start | integer | The year their rule began |
| end | integer | The year their rule ended |
| index | integer | A zero-based sequential number assigned to each entry, representing the chronological order of rulers |
| title | path |
|---|---|
| The Royal Family - Kings & Queens | https://www.royal.uk/kings-and-queens-1066 |
| The Royal Family - Interregnum | https://www.royal.uk/interregnum-1649-1660 |
| title | path |
|---|---|
| Open Government Licence v3.0 (UK) | https://www.nationalarchives.gov.uk/doc/open-government-licence/version/3/ |
movies.json
A collection of films and their performance metrics, including box office earnings, budgets, and audience ratings. Contains known data quality issues and intentional errors, serving as a teaching resource for developing data cleaning and validation skills in real-world analysis workflows.
| name | type |
|---|---|
| Title | string |
| US Gross | integer |
| Worldwide Gross | integer |
| US DVD Sales | integer |
| Production Budget | integer |
| Release Date | string |
| MPAA Rating | string |
| Running Time min | integer |
| Distributor | string |
| Source | string |
| Major Genre | string |
| Creative Type | string |
| Director | string |
| Rotten Tomatoes Rating | integer |
| IMDB Rating | number |
| IMDB Votes | integer |
normal-2d.json
Five hundred paired coordinates sampled from a bivariate normal distribution. The data is centered near the
origin with standard deviations indicating a relatively equal spread in both dimensions.
The variables exhibit negligible correlation (0.026), suggesting independence.
Normality tests for each variable yield high p-values, supporting the normal distribution assumption.
These characteristics make it well-suited for demonstrating statistical visualization techniques
in Vega and Vega-Lite, including scatter plots, density plots, heatmaps, and marginal histograms/density curves.
It can also serve as a clean baseline for testing new visualization methods or for educational purposes
in data visualization and statistics.
A contrast to uniformly distributed data in uniform-2d.json
| name | type | description |
|---|---|---|
| u | number | mean: 0.005, std: 0.192, range: [-0.578, 0.533], p-value: 0.680 |
| v | number | mean: -0.011, std: 0.199, range: [-0.534, 0.606], p-value: 0.763 |
| title |
|---|
| Generated Data |
| path |
|---|
| https://github.com/vega/vega-datasets/blob/main/scripts/LICENSE |
obesity.json
State-level obesity rates (BMI >= 30) for the U.S. in 1995. Originally Behavioral Risk Factor Surveillance System (BRFSS) statistics.
| name | type |
|---|---|
| id | integer |
| rate | number |
| state | string |
| title | path |
|---|---|
| Protovis | https://mbostock.github.io/protovis/ex/us_stats.js |
| title | path |
|---|---|
| U.S. Government Dataset | https://www.usa.gov/government-works |
ohlc.json
Performance of the Chicago Board Options Exchange Volatility Index (VIX) in the summer of 2009.
The precise methodology used to derive the signal and calculate the ret columns is unclear.
| name | type |
|---|---|
| date | date |
| open | number |
| high | number |
| low | number |
| close | number |
| signal | string |
| ret | number |
| title | path |
|---|---|
| Yahoo Finance VIX Data | https://finance.yahoo.com/chart/%5EVIX |
| CBOE - VIX Historical Data | https://www.cboe.com/tradable_products/vix/vix_historical_data/ |
penguins.json
Records of morphological measurements and demographic information from 344 Palmer Archipelago penguins across three species. Collected by Dr. Kristen Gorman and the Palmer Station Antarctica LTER. Data gathering occurred as part of Palmer Station's long-term ecological research, contributing to studies of Antarctic marine ecosystems and penguin biology. All measurements follow standardized units, enabling research into morphological variations between species and sexual dimorphism in Antarctic penguins.
| name | type | description |
|---|---|---|
| Species | string | Penguin species (Adelie, Gentoo, or Chinstrap) |
| Island | string | Island where the penguin was observed (Torgersen, Biscoe, or Dream) |
| Beak Length (mm) | number | Beak length in millimeters |
| Beak Depth (mm) | number | Beak depth in millimeters |
| Flipper Length (mm) | integer | Flipper length in millimeters |
| Body Mass (g) | integer | Body mass in grams |
| Sex | string | Sex of the penguin (MALE, FEMALE or null) |
| title | path |
|---|---|
| Palmer Station Antarctica LTER | https://pal.lternet.edu/ |
| Allison Horst's Penguins Repository | https://github.com/allisonhorst/penguins |
| name | path |
|---|---|
| CC0 1.0 Universal | https://github.com/allisonhorst/palmerpenguins?tab=CC0-1.0-1-ov-file#readme |
platformer-terrain.json
Assets from the video game Celeste. Added in #376
| name | type |
|---|---|
| x | integer |
| y | integer |
| lumosity | number |
| saturation | integer |
| name | string |
| id | string |
| color | string |
| key | string |
| title | path |
|---|---|
| Celeste Game | http://www.celestegame.com/ |
political-contributions.json
Summary financial information on contributions to candidates for U.S.
elections. An updated version is available from the "all candidates" files (in pipe-delimited format)
on the bulk data download page of the U.S. Federal Election Commission, or, alternatively, via OpenFEC.
Information on each of the 25 columns is available from the FEC All Candidates File Description.
The sample dataset in political-contributions.json contains 58 records with dates from 2015.
FEC data is subject to the commission's:
Additionally, the FEC's Github repository states:
This project is in the public domain within the United States, and we waive worldwide copyright and related rights through CC0 universal public domain dedication. Read more on our license page. A few restrictions limit the way you can use FEC data. For example, you can't use contributor lists for commercial purposes or to solicit donations. Learn more on FEC.gov.
| name | type |
|---|---|
| Candidate_Identification | string |
| Candidate_Name | string |
| Incumbent_Challenger_Status | string |
| Party_Code | integer |
| Party_Affiliation | string |
| Total_Receipts | number |
| Transfers_from_Authorized_Committees | integer |
| Total_Disbursements | number |
| Transfers_to_Authorized_Committees | number |
| Beginning_Cash | number |
| Ending_Cash | number |
| Contributions_from_Candidate | number |
| Loans_from_Candidate | integer |
| Other_Loans | integer |
| Candidate_Loan_Repayments | number |
| Other_Loan_Repayments | integer |
| Debts_Owed_By | number |
| Total_Individual_Contributions | integer |
| Candidate_State | string |
| Candidate_District | integer |
| Contributions_from_Other_Political_Committees | integer |
| Contributions_from_Party_Committees | integer |
| Coverage_End_Date | string |
| Refunds_to_Individuals | integer |
| Refunds_to_Committees | integer |
| title | path |
|---|---|
| Federal Election Commission Bulk Data | https://www.fec.gov/data/browse-data/?tab=bulk-data |
| OpenFEC API | https://api.open.fec.gov/developers/ |
| title | path |
|---|---|
| Creative Commons Zero 1.0 Universal | https://creativecommons.org/publicdomain/zero/1.0/ |
population.json
U.S. population counts by age group (0-90+ in 5-year intervals) and sex for each decade between 1850 and 2000, collected and harmonized from historical census records by IPUMS USA.
IPUMS updates and revises datasets over time, which may result in discrepancies with current IPUMS data.
When using this dataset, please refer to IPUMS USA terms of use. The organization requests the use of the following citation for this json file: Steven Ruggles, Katie Genadek, Ronald Goeken, Josiah Grover, and Matthew Sobek. Integrated Public Use Microdata Series: Version 6.0. Minneapolis: University of Minnesota, 2015. http://doi.org/10.18128/D010.V6.0
| name | type | description |
|---|---|---|
| year | integer | Four-digit year of the survey |
| age | integer | Age group in 5-year intervals (0=0-4, 5=5-9, 10=10-14, ..., 90=90+) |
| sex | integer | Sex (1=men, 2=women) |
| people | integer | Number of individuals (IPUMS PERWT) |
| title | path |
|---|---|
| IPUMS USA | https://usa.ipums.org/usa/ |
| title | path |
|---|---|
| IPUMS Terms of Use | https://www.ipums.org/about/terms |
population_engineers_hurricanes.csv
Per-state population, number of engineers, and hurricanes. Used in Vega-Lite example, Three Choropleths Representing Disjoint Data from the Same Table
| name | type |
|---|---|
| state | string |
| id | integer |
| population | integer |
| engineers | number |
| hurricanes | integer |
| title | path |
|---|---|
| Bureau of Labor Statistics | https://www.bls.gov/oes/tables.htm |
| American Community Survey | https://factfinder.census.gov/faces/tableservices/jsf/pages/productview.xhtml?pid=ACS_07_3YR_S1901&prodType=table |
| NOAA National Climatic Data Center | https://www.ncdc.noaa.gov/cdo-web/datatools/records |
| title | path |
|---|---|
| U.S. Government Dataset | https://www.usa.gov/government-works |
seattle-weather-hourly-normals.csv
Hourly weather normals with metric units. The 1981-2010 Climate Normals are NCDC's three-decade averages of climatological variables, including temperature and precipitation. Learn more in the documentation. We only included temperature, wind, and pressure and updated the format to be easier to parse.
| name | type |
|---|---|
| date | datetime |
| pressure | number |
| temperature | number |
| wind | number |
| title | path |
|---|---|
| NOAA National Climatic Data Center (NCDC) | https://www.ncdc.noaa.gov/cdo-web/datatools/normals |
| title | path |
|---|---|
| U.S. Government Dataset | https://www.usa.gov/government-works |
seattle-weather.csv
Daily weather in metric units. Transformed using /scripts/weather.py.
The categorical "weather" field is synthesized from multiple fields in the original dataset.
This data is intended for instructional purposes.
| name | type | description | categories |
|---|---|---|---|
| date | date | Date of the weather observation | |
| precipitation | number | Amount of precipitation in millimeters | |
| temp_max | number | Maximum daily temperature in degrees Celsius | |
| temp_min | number | Minimum daily temperature in degrees Celsius | |
| wind | number | Wind speed in kilometers per hour | |
| weather | string | Categorical weather type synthesized from original NOAA data fields. Categories include: drizzle, rain, snow, sun, and fog. | ['drizzle', 'rain', 'snow', 'sun', 'fog'] |
| title | path |
|---|---|
| NOAA National Climatic Data Center | https://www.ncdc.noaa.gov/cdo-web/datatools/records |
| title | path |
|---|---|
| U.S. Government Dataset | https://www.usa.gov/government-works |
sp500-2000.csv
S&P 500 index values from 2000 to 2020.
| name | type |
|---|---|
| date | date |
| open | number |
| high | number |
| low | number |
| close | number |
| adjclose | number |
| volume | integer |
| title | path |
|---|---|
| Yahoo Finance | https://finance.yahoo.com/quote/%5EDJI/history/ |
sp500.csv
Monthly closing values of the S&P 500 stock market index from January 2000 to March 2010. Captures several significant market events including the dot-com bubble burst (2000-2002), the mid-2000s bull market, and the 2008 financial crisis.
| name | type | description |
|---|---|---|
| date | string | Date of monthly observation in the format 'MMM D YYYY' |
| price | number | Closing price of the S&P 500 index for the given month |
stocks.csv
Monthly stock prices for five companies from 2000 to 2010.
| name | type |
|---|---|
| symbol | string |
| date | string |
| price | number |
udistrict.json
Point locations of restaurants and cafes in Seattle's University District, categorized by cuisine type. Used to create a ridgeline plot example showing the prevalence of various food and beverage categories. The example graphic using this dataset states that it originally appeared in Alaska Airlines Beyond Magazine (Sep 2017, p. 120)
| name | type |
|---|---|
| key | string |
| lat | number |
unemployment-across-industries.json
Industry-level unemployment from the Current Population Survey
(CPS), published monthly by the U.S. Bureau of Labor Statistics. Includes unemployed persons
and unemployment rate across 11 private industries, as well as agricultural, government, and
self-employed workers. Covers January 2000 through February 2010. Industry classification
follows format of CPS Table A-31. Transformed using scripts/make-unemployment-across-industries.py
The BLS Web site states:
"Users of the public API should cite the date that data were accessed or retrieved using the API. Users must clearly state that "BLS.gov cannot vouch for the data or analyses derived from these data after the data have been retrieved from BLS.gov." The BLS.gov logo may not be used by persons who are not BLS employees or on products (including web pages) that are not BLS-sponsored."
See full BLS terms of service.
| name | type | description |
|---|---|---|
| series | string | Industry name |
| year | integer | Year (2000-2010) |
| month | integer | Month (1-12) |
| count | integer | Number of unemployed persons (in thousands) |
| rate | number | Unemployment rate (percentage) |
| date | datetime | ISO 8601-formatted date string (e.g., "2000-01-01T08:00:00.000Z") |
| title | path |
|---|---|
| U.S. Census Bureau Current Population Survey | https://www.census.gov/programs-surveys/cps.html |
| BLS LAUS Data Tools | https://www.bls.gov/lau/data.htm |
| Bureau of Labor Statistics Table A-31 | https://www.bls.gov/web/empsit/cpseea31.htm |
| title | path |
|---|---|
| U.S. Government Dataset | https://www.usa.gov/government-works |
unemployment.tsv
County-level unemployment rates in the United States, with data generally consistent with levels reported in 2009. The dataset is structured as tab-separated values. The unemployment rate represents the number of unemployed persons as a percentage of the labor force. According to the Bureau of Labor Statistics (BLS) glossary:
Unemployed persons (Current Population Survey) [are] persons aged 16 years and older who had no employment during the reference week, were available for work, except for temporary illness, and had made specific efforts to find employment sometime during the 4-week period ending with the reference week. Persons who were waiting to be recalled to a job from which they had been laid off need not have been looking for work to be classified as unemployed.
Derived from the Local Area Unemployment Statistics (LAUS) program, a federal-state cooperative effort overseen by the Bureau of Labor Statistics (BLS). The LAUS program produces monthly and annual employment, unemployment, and labor force data for census regions and divisions, states, counties, metropolitan areas, and many cities and towns.
For the most up-to-date LAUS data:
- Monthly and Annual Data Downloads:
- Visit the LAUS Data Tools page for monthly and annual county data.
- BLS Public Data API:
- The BLS provides an API for developers to access various datasets, including LAUS data.
- To use the API for LAUS data, refer to the LAUS Series ID Formats to construct your query.
- API documentation and examples are available on the BLS Developers page.
When using BLS public data API and datasets, users should adhere to the BLS Terms of Service.
| name | type | description |
|---|---|---|
| id | integer | The combined state and county FIPS code |
| rate | number | The unemployment rate for the county |
| title | path |
|---|---|
| BLS Developers API | https://www.bls.gov/developers/ |
| BLS Handbook of Methods | https://www.bls.gov/opub/hom/lau/home.htm |
| title | path |
|---|---|
| U.S. Government Dataset | https://www.usa.gov/government-works |
uniform-2d.json
Five hundred paired coordinates (u, v) sampled from a bivariate uniform distribution. Centered near the
origin with ranges spanning approximately [-0.5, 0.5] in both dimensions. The variables exhibit negligible
correlation (-0.019), suggesting independence, as expected for a uniform distribution.
A contrast to normally distributed data in normal-2d.json.
| name | type | description |
|---|---|---|
| u | number | mean: 0.015, std: 0.277, range: [-0.499, 0.500] |
| v | number | mean: -0.013, std: 0.276, range: [-0.500, 0.498] |
| title |
|---|
| Generated Data |
| path |
|---|
| https://github.com/vega/vega-datasets/blob/main/scripts/LICENSE |
us-10m.json
US county boundaries represented at a 1:10,000,000 scale in TopoJSON format, which optimizes for smaller file sizes. Similar to offerings in the TopoJSON US Atlas collection, which in turn is a redistribution of the Census Bureau's cartographic boundary shapefiles.
| title | path |
|---|---|
| TopoJSON US Atlas | https://github.com/topojson/us-atlas |
| US Census Bureau Cartographic Boundary FIles | https://www.census.gov/geographies/mapping-files/time-series/geo/cartographic-boundary.html |
| title | path |
|---|---|
| TopoJSON US Atlas ISC License | https://github.com/topojson/us-atlas/blob/master/LICENSE.md |
us-employment.csv
Monthly employment total in a variety of job categories from January 2006 through December 2015, seasonally adjusted and reported in thousands. Downloaded and reformatted on Nov. 11, 2018.
In the mid 2000s the global economy was hit by a crippling recession. One result: Massive job losses across the United States. The downturn in employment, and the slow recovery in hiring that followed, was tracked each month by the Current Employment Statistics program at the U.S. Bureau of Labor Statistics.
Totals are included for the 22 "supersectors" tracked by the BLS. The "nonfarm" total is the category typically used by economists and journalists as a stand-in for the country's employment total.
A calculated "nonfarm_change" column has been appended with the month-to-month change in that supersector's employment. It is useful for illustrating how to make bar charts that report both negative and positive values.
| name | type |
|---|---|
| month | date |
| nonfarm | integer |
| private | integer |
| goods_producing | integer |
| service_providing | integer |
| private_service_providing | integer |
| mining_and_logging | integer |
| construction | integer |
| manufacturing | integer |
| durable_goods | integer |
| nondurable_goods | integer |
| trade_transportation_utilties | integer |
| wholesale_trade | number |
| retail_trade | number |
| transportation_and_warehousing | number |
| utilities | number |
| information | integer |
| financial_activities | integer |
| professional_and_business_services | integer |
| education_and_health_services | integer |
| leisure_and_hospitality | integer |
| other_services | integer |
| government | integer |
| nonfarm_change | integer |
| title | path |
|---|---|
| U.S. Bureau of Labor Statistics Current Employment Statistics | https://www.bls.gov/ces/ |
| title | path |
|---|---|
| U.S. Government Dataset | https://www.usa.gov/government-works |
us-state-capitals.json
Geographical coordinates and names of U.S. state capitals, transformed using scripts/us-state-capitals.py.
Includes latitude, longitude, state name, and capital city name for all 50 U.S. states.
Cities are represented as point locations of their capitol buildings using coordinates in the
WGS84 geographic coordinate system.
According to USGS
"Map services and data downloaded from The National Map are free and in the public domain. There are no restrictions; however, we request that the following acknowledgment statement of the originating agency be included in products and data derived from our map services when citing, copying, or reprinting: Map services and data available from U.S. Geological Survey, National Geospatial Program."
| name | type |
|---|---|
| lon | number |
| lat | number |
| state | string |
| city | string |
| title | path |
|---|---|
| U.S. Geological Survey National Geospatial Program - The National Map | https://www.usgs.gov/programs/national-geospatial-program/national-map |
| title | path |
|---|---|
| U.S. Public Domain | https://www.usgs.gov/information-policies-and-instructions/copyrights-and-credits |
| U.S. Government Dataset | https://www.usa.gov/government-works |
volcano.json
Elevation measurements of Maunga Whau (Mt Eden), a volcano in Auckland, New Zealand, representing a rectangular area of 870 meters by 610 meters. Spacing between measurement points is approximately 10 meters in both directions. Digitized from a topographic map by Ross Ihaka and adapted from R datasets, Should not be regarded as accurate.
| title | path |
|---|---|
| R Datasets | https://stat.ethz.ch/R-manual/R-patched/library/datasets/html/volcano.html |
weather.csv
Daily weather observations from Seattle and New York.
Transformed from NOAA data using the script /scripts/weather.py.
The categorical "weather" field is synthesized from multiple fields in the original dataset.
Intended for instructional purposes.
| name | type | description | categories |
|---|---|---|---|
| location | string | City location of the weather observation (Seattle or New York) | |
| date | date | Date of the weather observation | |
| precipitation | number | Amount of precipitation in millimeters | |
| temp_max | number | Maximum daily temperature in degrees Celsius | |
| temp_min | number | Minimum daily temperature in degrees Celsius | |
| wind | number | Wind speed in kilometers per hour | |
| weather | string | Categorical weather type synthesized from original NOAA data fields. Categories include: drizzle, rain, snow, sun, and fog. | ['drizzle', 'rain', 'snow', 'sun', 'fog'] |
| title | path |
|---|---|
| NOAA Climate Data Online | http://www.ncdc.noaa.gov/cdo-web/datatools/findstation |
| title | path |
|---|---|
| U.S. Government Dataset | https://www.usa.gov/government-works |
weekly-weather.json
Instructional dataset showing actual and predicted temperature data.
Important
Named weather.json in previous versions (v1.4.0 - v2.11.0).
wheat.json
As noted by in this protovis example, "In an 1822 letter to Parliament, William Playfair, a Scottish engineer who is often credited as the founder of statistical graphics, published an elegant chart on the price of wheat. It plots 250 years of prices alongside weekly wages and the reigning monarch. He intended to demonstrate that:
'never at any former period was wheat so cheap, in proportion to mechanical labour, as it is at the present time.'"
| name | type |
|---|---|
| year | integer |
| wheat | number |
| wages | number |
| title | path |
|---|---|
| 1822 Playfair Chart | https://commons.wikimedia.org/wiki/File:Chart_Showing_at_One_View_the_Price_of_the_Quarter_of_Wheat,_and_Wages_of_Labour_by_the_Week,_from_1565_to_1821.png |
| title | path |
|---|---|
| Public Domain | https://commons.wikimedia.org/wiki/Public_domain |
windvectors.csv
Simulated wind patterns over northwestern Europe.
| name | type |
|---|---|
| longitude | number |
| latitude | number |
| dir | integer |
| dirCat | integer |
| speed | number |
world-110m.json
A 1:110,000,000-scale world map in TopoJSON format, optimized for web-based visualization. The simplified geographic boundaries focus on two key elements: land masses and country borders with their corresponding codes. The high level of generalization removes small geographic details while maintaining recognizable global features, making it ideal for overview maps and basic world visualizations. This format provides efficient compression compared to GeoJSON, reducing file size for web use. Part of the widely-used TopoJSON World Atlas collection, this has become a standard resource for creating web-based world maps where precise boundary detail isn't required.
| title | path |
|---|---|
| TopoJSON World Atlas (Likely original source, processed from Natural Earth data) | https://github.com/topojson/world-atlas |
| Natural Earth Data - Admin 0 Countries (1:110m) | https://www.naturalearthdata.com/downloads/110m-cultural-vectors/110m-admin-0-countries/ |
| title | path |
|---|---|
| TopoJSON World Atlas ISC License | https://github.com/topojson/world-atlas/blob/master/LICENSE.md |
| Natural Earth Data Public Domain | https://www.naturalearthdata.com/about/terms-of-use/ |
zipcodes.csv
Postal codes mapped to their geographical coordinates (latitude/longitude in WGS84) and administrative hierarchies, for the United States and Puerto Rico. The GeoNames geographical database provides worldwide postal code data with associated geographical and administrative information.
Historical snapshot first contributed to vega-datasets in 2017 and no longer current. Administrative boundaries have been redrawn, counties reorganized and renamed, and postal codes modified. Latitude/longitude coordinates have been updated by Geonames since this data was collected. For current postal code data, refer to the main GeoNames database.
| name | type |
|---|---|
| zip_code | integer |
| latitude | number |
| longitude | number |
| city | string |
| state | string |
| county | string |
| title | path |
|---|---|
| GeoNames Postal Codes | https://download.geonames.org/export/zip/ |
| title | path |
|---|---|
| Creative Commons Attribution 4.0 International | https://creativecommons.org/licenses/by/4.0/ |