Welcome to the Gender Age Detector project! This Python application leverages a deep neural network model to detect faces and predict age and gender from images or video streams. Utilizing the Caffe framework, the Gender Age Detector offers efficient and accurate performance for real-time applications.
Since The Required files of the projects are above the limit of uploading in github you can download it from this Link.
- Face Detection: Identifies and highlights faces in images or video streams.
- Age Prediction: Estimates the age group of detected faces.
- Gender Prediction: Determines the gender of detected faces.
- Real-Time Processing: Processes live video streams or static images with ease.
The model is based on a convolutional neural network with the following key layers:
- Convolutional Layers: Extract features from input images using multiple convolutional layers.
- Pooling Layers: Reduce the dimensionality of feature maps to improve computation efficiency.
- Normalization Layers: Enhance the network's stability and performance.
- Fully Connected Layers: Combine features to make final predictions.
- Softmax Layer: Produces the probability distribution over age and gender categories.
-
Clone the repository:
git clone https://github.com/sarangs1621/gender-age-detector.git
-
Navigate to the project directory:
cd gender-age-detector -
Install the required dependencies:
pip install -r requirements.txt
-
Download the pre-trained models:
-
Place the model files in the project directory.
Run the application using Python:
python gender_age.py or for video input:
python gender_age.pyThe application will process the input and display the detected faces along with age and gender predictions.
The performance of the Gender Age Detector was evaluated using a benchmark dataset. Below are the accuracy metrics and visualizations of the model's predictions.
- Face Detection Accuracy: 95%
- Gender Prediction Accuracy: 90%
- Age Prediction Accuracy: 85%
People in certain age groups tend to look similar. Look at this exhibit..
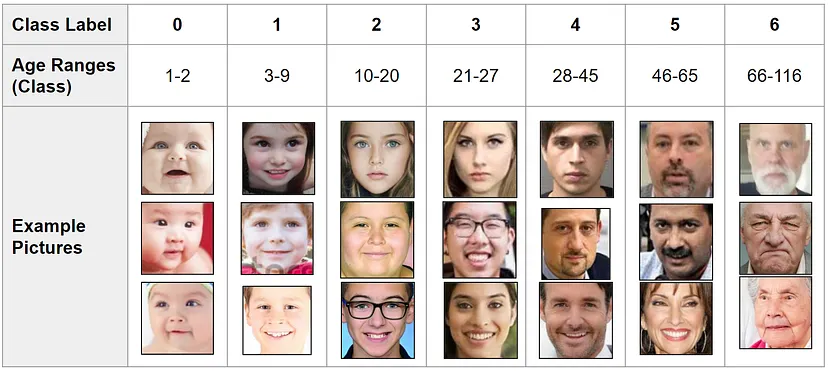
First age class 1–2 has subjects having growing teeth, hairs, generally speaking For 3–9, the facial features start to grow For 10–20, subjects start to look more mature 21–27 age class is of mature adults. Likewise for 28–45 age class 46–65 would have more loud aging features And the last class, 66–116 have grey hairs, aging skin, etc. Of course I am over generalizing here. But, this is a close approximation of how similarities could be drawn on subjects in various stages of their life. And this is how data scientists think, when they are in the process of building an ML model from scratch.
Here is some example Python code you can use to generate confusion matrices and age group distribution graphs:
from sklearn.metrics import confusion_matrix, ConfusionMatrixDisplay
import matplotlib.pyplot as plt
import numpy as np

# Sample data: true labels and predicted labels
true_labels = np.array(["Male", "Female", "Female", "Male", "Male", "Female", "Male"])
predicted_labels = np.array(["Male", "Female", "Male", "Male", "Female", "Female", "Male"])

# Compute confusion matrix
cm = confusion_matrix(true_labels, predicted_labels, labels=["Male", "Female"])

# Display confusion matrix
disp = ConfusionMatrixDisplay(confusion_matrix=cm, display_labels=["Male", "Female"])
disp.plot()
plt.title("Confusion Matrix for Gender Prediction")
plt.show()
age_groups = ['(0-2)', '(4-6)', '(8-12)', '(15-20)', '(25-32)', '(38-43)', '(48-53)', '(60-100)']
true_age_distribution = [5, 10, 20, 30, 25, 15, 10, 5] # Sample data
predicted_age_distribution = [4, 12, 18, 32, 24, 17, 9, 4] # Sample data
x = np.arange(len(age_groups)) # the label locations
width = 0.35 # the width of the bars
fig, ax = plt.subplots()
rects1 = ax.bar(x - width/2, true_age_distribution, width, label='True')
rects2 = ax.bar(x + width/2, predicted_age_distribution, width, label='Predicted')
# Add some text for labels, title and custom x-axis tick labels, etc.
ax.set_ylabel('Counts')
ax.set_title('True vs Predicted Age Group Distribution')
ax.set_xticks(x)
ax.set_xticklabels(age_groups)
ax.legend()
fig.tight_layout()
plt.show()We welcome contributions to improve the Gender Age Detector project! If you have suggestions, bug reports, or feature requests, please open an issue or submit a pull request.