This project is comprised of a shell script that runs as often as desired (I recommend every 12 hours) collecting data from linux using the "smartctl" and "nvme smart-log" commands for all drives installed within the system (including USB drives) and placing it into InfluxDB. This script will also send email notifications of up to 20x drive SMART parameters are either above, equal to, or below a value of your choice.
Explore the docs »
Report Bug
·
Request Feature
Table of Contents
The script collects Disk SMART details for SATA drives and USB drives using the smartctl commands, and NVME drives using nvme smart-log commands. It saves the data to InfluxDB. This script will also send email notifications for up to 20x drive SMART parameters that are either above, equal to, or below a configurable value in a basic web interface.
This project is written to be supported on any system with both smartctl and nvme commands installed / available.
-
This script should be run through CRONTAB with a recommended operating frequency of every 12 hours, however it can run up to every 60 seconds if desired. Details on configuring task scheduler (Synology) or editing CRONTAB are below.
-
This project requires a functional PHP server to be installed to allow the web-administrative configuration page to be available. This read-me does explain how to configure the needed read/write permissions of the web-station "http" user on a Synology NAS, but does not otherwise explain how to setup a website using PHP.
Note: This README assumes InfluxDB version 2.0 or higher and Grafana are already installed and properly configured. This read-me does NOT explain how to install and configure InfluxDB nor Grafana.
- Create the following directories on the system
1. %PHP_Server_Root%/config
2. %PHP_Server_Root%/logging
3. %PHP_Server_Root%/logging/notifications
note: %PHP_Server_Root% is what ever shared folder location the PHP web server root directory is configured to be.
-
Place the
functions.phpfile in the root of the PHP web server running on the such as/volume1/web -
Place the
smart.shfile in the/loggingdirectory -
Place the
smart_config.phpfile in the/configdirectory
- Open the
smart.shfile in a text editor. I suggest Notepad++ - the script contains the following configuration variables. un-comment the five lines below
debug=0
#########################################################
#SCRIPT VARIABLES
#if a different directory is desired, change these variables accordingly
email_contents="/volume1/web/logging/notifications/SMART_Logging_email_contents.txt"
lock_file_location="/volume1/web/logging/notifications/SMART_Logging.lock"
email_last_sent="/volume1/web/logging/notifications/${0##*/}_SMART_Logging_last_message_sent.txt"
debug=0
#config_file_location="/volume1/web/config"
#config_file_name="smart_logging_config.txt"
#measurement="Disk_SMART"
#nas_name="Server_Name"
#use_sendmail=1

#########################################################
#EMAIL SETTINGS USED IF CONFIGURATION FILE IS UNAVAILABLE
#These variables will be overwritten with new corrected data if the configuration file loads properly.
email_address="email@email.com"
from_email_address="email@email.com"
#########################################################
For email_contents ensure the path is the same as the directory %PHP_Server_Root%/logging/notifications that was previously created.
For lock_file_location ensure the path is the same as the directory %PHP_Server_Root%/logging/notifications that was previously created.
For email_last_sent ensure the path is the same as the directory %PHP_Server_Root%/logging/notifications that was previously created.
For debug=0 change this to a value of "1" to see verbose output from the script. This is useful during initial script installation and configuration.
For config_file_location ensure the path is the same as the directory %PHP_Server_Root%/config that was previously created.
For #measurement="Disk_SMART" change the value to the desired InfluxDB measurement description of your choice
For nas_name="Server_Name" change to a value of your choice to describe the name of the system SMART data is being collected from
For use_sendmail=1 set to a value of 1 to use "sendmail" command and set to a value of 0 to use the "ssmtp" command to send email notifications
For the EMAIL SETTINGS USED IF CONFIGURATION FILE IS UNAVAILABLE settings, configure the email address details as desired.
- Delete the the following lines as those are for my personal use as I use this script for several units that have slightly different configurations
#for my personal use as i have multiple Synology systems, these lines can be deleted and the variables above can be un-commented
######################################################################################
sever_type=1 #1=server2, 2=serverNVR, 3=serverplex

if [[ $sever_type == 1 ]]; then
	config_file_location="/volume1/web/config/config_files/config_files_local"
	config_file_name="smart_logging_config.txt"
	measurement="synology_SMART_status2"
	nas_name="Server2"
	use_sendmail=1
fi

if [[ $sever_type == 2 ]]; then
	config_file_location="/volume1/web/logging"
	config_file_name="smart_logging_config.txt"
	measurement="synology_SMART_status2"
	nas_name="Server_NVR"
	use_sendmail=1
fi

if [[ $sever_type == 3 ]]; then
	config_file_location="/volume1/web/config/config_files/config_files_local"
	config_file_name="smart_logging_config.txt"
	measurement="synology_SMART_status2"
	nas_name="Server-Plex"
	use_sendmail=1
fi

######################################################################################
- Open the
smart_config.phpfile in a text editor - the script contains the following configuration variables
$config_file="/volume1/web/config/config_files/config_files_local/smart_logging_config.txt";
$use_login_sessions=true; //set to false if not using user login sessions
$form_submittal_destination="index.php?page=6&config_page=smart_server2"; //set to the destination the HTML form submit should be directed to
$page_title="Server2 SMART Logging and Notification Configuration Settings";
ENSURE THE VALUES FOR $config_file ARE THE SAME AS THAT CONFIGURED IN [Configuration "ssmart.sh"] FOR THE VARIABLE config_file_location
The form_submittal_destination can either be set to the name of the "smart_config.php" file itself if accessing the php file directly in the browser address bar, or if the "smart_config.php" file is embedded in another PHP file using an "include_once" then the location should be to that php file as the included example currently shows.
The variable page_title controls the title of the page when viewing it in a browser.
The smart_config.php file by default automatically redirects from HTTP to HTTPS. If this behavior is not required or desired, change the use_login_sessions to false. the setting should only be set to true if using active user log-in sessions in your PHP web site for stronger access control.
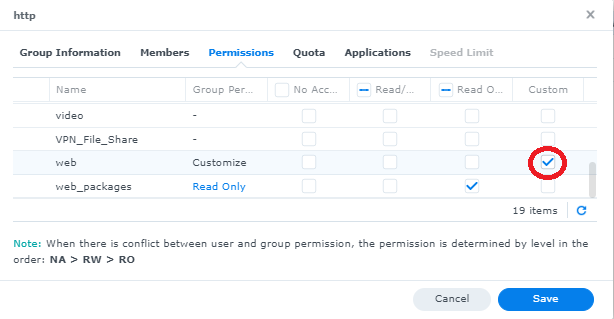
By default the Synology user "http" utilized by web station does not have write permissions to the "web" file share. Note, in this example, it is assumed the "web" file share is the directory web station will use for its %PHP_Server_Root%. If a different shared folder is used, adjust accordingly.
- Go to Control Panel -> User & Group -> "Group" tab
- Click on the "http" user and press the "edit" button
- Go to the "permissions" tab
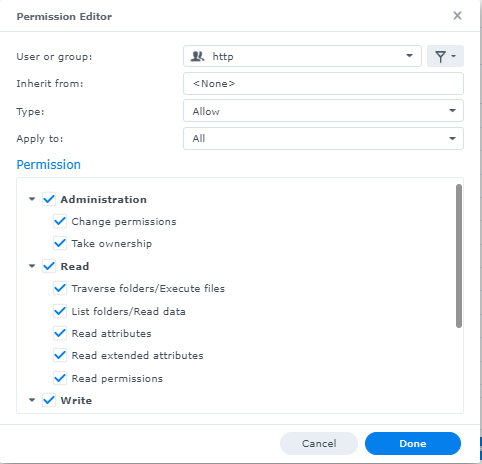
- Scroll down the list of shared folders to find "web" and click on the right checkbox under "customize"
- Check ALL boxes and click "done"
- Verify the window indicates the "http" user group has "Full Control" and click the checkbox at the bottom "Apply to this folder, sub folders and files" and click "Save"

- Now that the files are where they need to be, using a browser go to the "smart_config.php" page for example
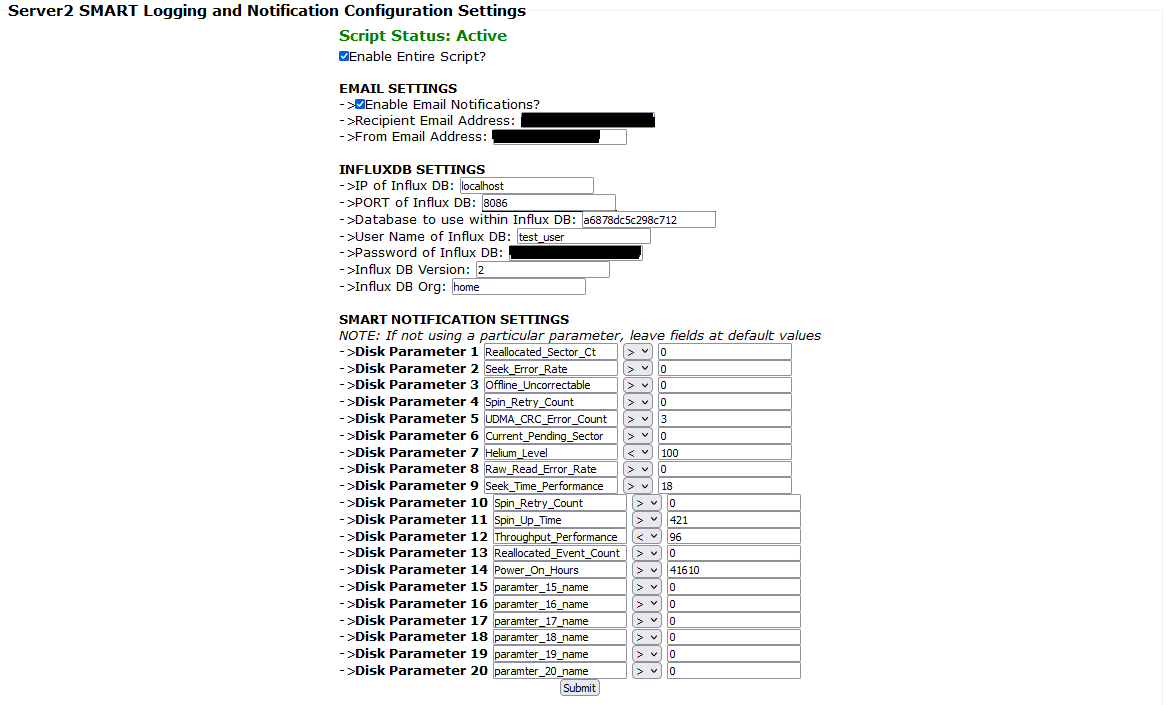
http://<NAS-IP>/config/smart_config.php. When the page loads for the first time, it will automatically create a "smart_logging_config.txt" in the config directory created previously. The values will all be default values and must be configured or the script will not operate. - Ensure the script is enabled
- Configure email settings, the destination email address, the from email address
- Enter the details for influxDB.
--> for InfluxDB 2, the "database" will be the randomly generated string identifying the data bucket, for example "a6878dc5c298c712"
--> for InfluxDB 2, the "User Name of Influx DB" can be left as the default value as this is NOT required for InfluxDB version 2 and higher.
--> for InfluxDB 2, the "Password" is the API access key / Authorization Token.
- Configure the SMART notification settings. NOTE: these settings will need to be changed after the script is run for the first time. This is due to every drive using different SMART parameter names. The parameter names entered into the configuration page will need to match what is gathered from your system.
Now that the required configuration files are made using the web-interface, we can ensure the bash script operates correctly.
- Open the
smart.shfile for editing. Find the linedebug=0and change todebug=1to enable verbose output to assist with debugging - Open SSH and navigate to where the
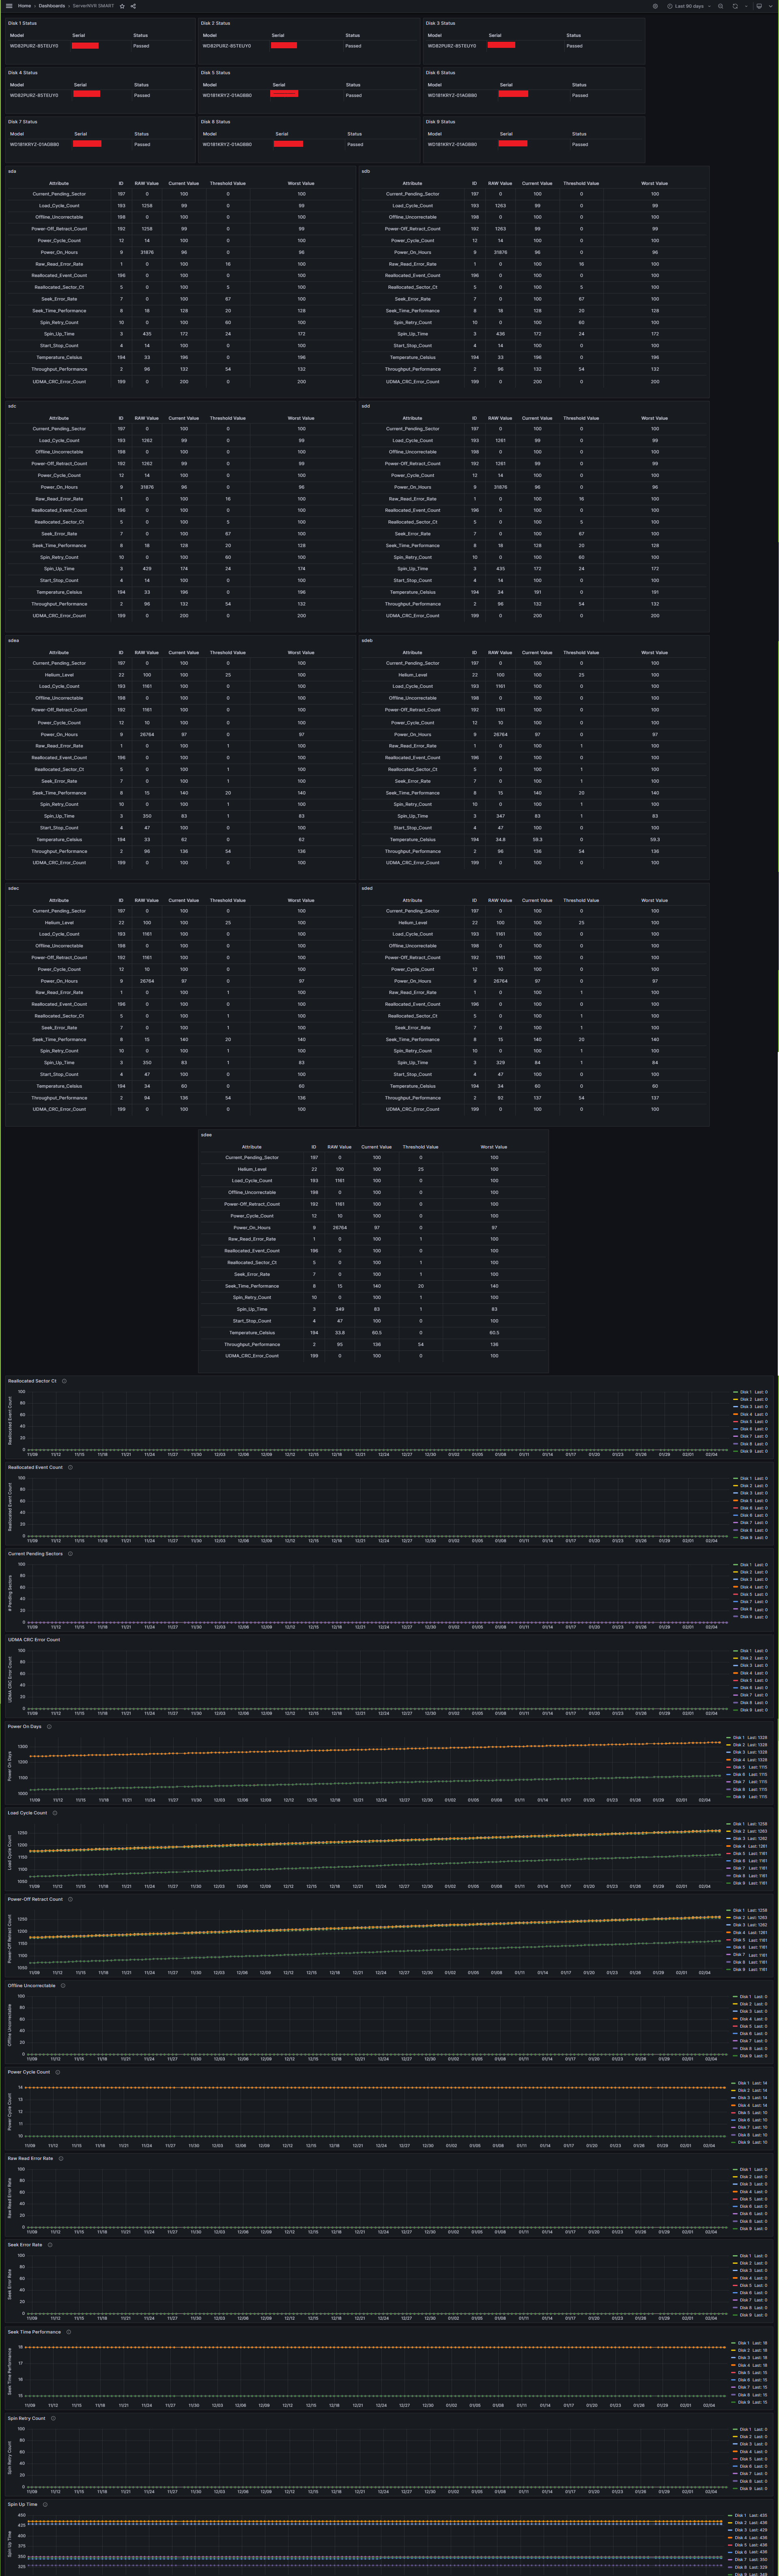
smart.shfile is located. Type the following commandbash smart.shand press enter - The script will run and load all of the configuration settings. In debug mode it will print out details of your system. The script will display the values of each drive's parameters. Here is the output from one of my systems with 9x drives installed. NOTE: Data for only one drive is shown for brevity.
root@Server_NVR:/volume1/web/logging# bash smart.sh
nvme_number_installed is -1
no NVME drives installed, skipping NVME capture
synology_SMART_status2,nas_name=Server_NVR,disk_path=/dev/sdc,smart_attribute=Raw_Read_Error_Rate disk_model="WD82PURZ-85TEUY0",disk_serial="xxxxxxx",ID=1,current_value=100,worst_value=100,threshold_value=016,RAW_value=0,disk_status=1
synology_SMART_status2,nas_name=Server_NVR,disk_path=/dev/sdc,smart_attribute=Throughput_Performance disk_model="WD82PURZ-85TEUY0",disk_serial="xxxxxxx",ID=2,current_value=132,worst_value=132,threshold_value=054,RAW_value=96,disk_status=1
synology_SMART_status2,nas_name=Server_NVR,disk_path=/dev/sdc,smart_attribute=Spin_Up_Time disk_model="WD82PURZ-85TEUY0",disk_serial="xxxxxxx",ID=3,current_value=174,worst_value=174,threshold_value=024,RAW_value=429,disk_status=1
synology_SMART_status2,nas_name=Server_NVR,disk_path=/dev/sdc,smart_attribute=Start_Stop_Count disk_model="WD82PURZ-85TEUY0",disk_serial="xxxxxxx",ID=4,current_value=100,worst_value=100,threshold_value=000,RAW_value=14,disk_status=1
synology_SMART_status2,nas_name=Server_NVR,disk_path=/dev/sdc,smart_attribute=Reallocated_Sector_Ct disk_model="WD82PURZ-85TEUY0",disk_serial="xxxxxxx",ID=5,current_value=100,worst_value=100,threshold_value=005,RAW_value=0,disk_status=1
synology_SMART_status2,nas_name=Server_NVR,disk_path=/dev/sdc,smart_attribute=Seek_Error_Rate disk_model="WD82PURZ-85TEUY0",disk_serial="xxxxxxx",ID=7,current_value=100,worst_value=100,threshold_value=067,RAW_value=0,disk_status=1
synology_SMART_status2,nas_name=Server_NVR,disk_path=/dev/sdc,smart_attribute=Seek_Time_Performance disk_model="WD82PURZ-85TEUY0",disk_serial="xxxxxxx",ID=8,current_value=128,worst_value=128,threshold_value=020,RAW_value=18,disk_status=1
synology_SMART_status2,nas_name=Server_NVR,disk_path=/dev/sdc,smart_attribute=Power_On_Hours disk_model="WD82PURZ-85TEUY0",disk_serial="xxxxxxx",ID=9,current_value=096,worst_value=096,threshold_value=000,RAW_value=31876,disk_status=1
synology_SMART_status2,nas_name=Server_NVR,disk_path=/dev/sdc,smart_attribute=Spin_Retry_Count disk_model="WD82PURZ-85TEUY0",disk_serial="xxxxxxx",ID=10,current_value=100,worst_value=100,threshold_value=060,RAW_value=0,disk_status=1
synology_SMART_status2,nas_name=Server_NVR,disk_path=/dev/sdc,smart_attribute=Power_Cycle_Count disk_model="WD82PURZ-85TEUY0",disk_serial="xxxxxxx",ID=12,current_value=100,worst_value=100,threshold_value=000,RAW_value=14,disk_status=1
synology_SMART_status2,nas_name=Server_NVR,disk_path=/dev/sdc,smart_attribute=Power-Off_Retract_Count disk_model="WD82PURZ-85TEUY0",disk_serial="xxxxxxx",ID=192,current_value=099,worst_value=099,threshold_value=000,RAW_value=1262,disk_status=1
synology_SMART_status2,nas_name=Server_NVR,disk_path=/dev/sdc,smart_attribute=Load_Cycle_Count disk_model="WD82PURZ-85TEUY0",disk_serial="xxxxxxx",ID=193,current_value=099,worst_value=099,threshold_value=000,RAW_value=1262,disk_status=1
synology_SMART_status2,nas_name=Server_NVR,disk_path=/dev/sdc,smart_attribute=Temperature_Celsius disk_model="WD82PURZ-85TEUY0",disk_serial="xxxxxxx",ID=194,current_value=196,worst_value=196,threshold_value=000,RAW_value=33,disk_status=1
synology_SMART_status2,nas_name=Server_NVR,disk_path=/dev/sdc,smart_attribute=Reallocated_Event_Count disk_model="WD82PURZ-85TEUY0",disk_serial="xxxxxxx",ID=196,current_value=100,worst_value=100,threshold_value=000,RAW_value=0,disk_status=1
synology_SMART_status2,nas_name=Server_NVR,disk_path=/dev/sdc,smart_attribute=Current_Pending_Sector disk_model="WD82PURZ-85TEUY0",disk_serial="xxxxxxx",ID=197,current_value=100,worst_value=100,threshold_value=000,RAW_value=0,disk_status=1
synology_SMART_status2,nas_name=Server_NVR,disk_path=/dev/sdc,smart_attribute=Offline_Uncorrectable disk_model="WD82PURZ-85TEUY0",disk_serial="xxxxxxx",ID=198,current_value=100,worst_value=100,threshold_value=000,RAW_value=0,disk_status=1
synology_SMART_status2,nas_name=Server_NVR,disk_path=/dev/sdc,smart_attribute=UDMA_CRC_Error_Count disk_model="WD82PURZ-85TEUY0",disk_serial="xxxxxxx",ID=199,current_value=200,worst_value=200,threshold_value=000,RAW_value=0,disk_status=1
NOTE: if the script displays any messages about GPT PMBR size mismatch those can be ignored.
- At the end of the script, it will send the results to InfluxDB. Ensure you do NOT see any instances of the following
{"code":"invalid","message":"unable to parse
or
No Such Instance currently exists at this OID
or
invalid number
These errors indicate that InfluxDB cannot intake the data properly and debugging is needed. Ensure no other errors were listed in the script output and ensure all values of the configuration parameters displayed in debug mode were correct.
7.) After it is confirmed the script is working without errors and that it is confirmed that InfluxDB is receiving the data correctly, change the debug=1 back to a debug=0
8.) Now proceed with creating a scheduled task or CRONTAB entry to run the script as often as desired. I recommend every 12 hours.
- Control Panel -> Task Scheduler
- Click
Create -> Scheduled Task -> User-defined script - Under "General Settings" name the script "Synology SMART" and choose the "root" user and ensure the task is enabled
- Click the "Schedule" tab at the top of the window
- Select "Run on the following days" and choose "Daily"
- Under Time, set "First run time" to "11" and "00"
- Under "Frequency" select every 12 hours
- Under last run time select "23:00"
- Go to the "Task Settings" tab
- Leave "Send run details by email" un-checked
- Under "Run command" enter "bash /volume1/web/logging/synology_SMART_snmp.sh" NOTE: ensure the
/volume1/webis the same as your PHP server root directory - Click "ok" in the bottom right
- Find the newly created task in your list, right click and select "run". when a confirmation window pops up, choose "yes"
- Verify the script ran correctly by going into Influxdb and viewing the collected data and verify fresh data was just added.
details on crontab can be found here: https://man7.org/linux/man-pages/man5/crontab.5.html
- Open the CRONTAB file. It's location is not always consistent. If using Synology for example, you can use
vi /etc/crontab - create two lines, each separated by 12 hours
line 1: 0 11 * * * root %PHP_Server_Root%/logging/smart.sh this will run the script every day at 11:00 AM
line 2: 0 23 * * * root %PHP_Server_Root%/logging/smart.sh this will run the script every day at 11:00 PM
Two dashboard JSON files are available. One for SSD's and one for regular spinning rust HDD's. The entire dashboard is written around the new FLUX language which is more powerful and simpler to use.
there are several different items in the JSON that will need to be adjusted to match your installation. the first the bucket it is drawing data from. edit this to match your bucket name
from(bucket: \"Test/autogen\")
next, edit the name of the server the data is being pulled for. the "Server-Plex" entry is used in the SSD specific dashboard while the "Server2" is for the normal HDD dashboard
r[\"nas_name\"] == \"Server-Plex\")
or
r[\"nas_name\"] == \"Server2\")
unfortunately because different drives have different numbers and different names for their particular SMART attributes, you will have to edit all of the dashboard properties to pull the correct attributes for your system's drives.
for example, for the "Sata1" table showing the SMART attributes, the flux query is:
from(bucket: "Test/autogen")
  |> range(start: v.timeRangeStart, stop: v.timeRangeStop)
  |> filter(fn: (r) => r["_measurement"] == "synology_SMART_status2")
  |> filter(fn: (r) => r["_field"] == "ID" or r["_field"] == "RAW_value" or r["_field"] == "current_value" or r["_field"] == "threshold_value" or r["_field"] == "worst_value")
  |> filter(fn: (r) => r["nas_name"] == "Server2")
  |> filter(fn: (r) => r["disk_path"] == "/dev/sata1")
  |> filter(fn: (r) => r["smart_attribute"] == "Current_Pending_Sector" or r["smart_attribute"] == "Load_Cycle_Count" or r["smart_attribute"] == "Helium_Level" or r["smart_attribute"] == "Offline_Uncorrectable" or r["smart_attribute"] == "Power-Off_Retract_Count" or r["smart_attribute"] == "Power_Cycle_Count" or r["smart_attribute"] == "Power_On_Hours" or r["smart_attribute"] == "Raw_Read_Error_Rate" or r["smart_attribute"] == "Reallocated_Event_Count" or r["smart_attribute"] == "Seek_Error_Rate" or r["smart_attribute"] == "Reallocated_Sector_Ct" or r["smart_attribute"] == "Seek_Time_Performance" or r["smart_attribute"] == "Spin_Retry_Count" or r["smart_attribute"] == "Spin_Up_Time" or r["smart_attribute"] == "Start_Stop_Count" or r["smart_attribute"] == "Temperature_Celsius" or r["smart_attribute"] == "Throughput_Performance" or r["smart_attribute"] == "UDMA_CRC_Error_Count")
  |> aggregateWindow(every: v.windowPeriod, fn: last, createEmpty: false)
  |> last()
  |> limit(n: 1)
  |> pivot(rowKey: ["_time"], columnKey: ["_field"], valueColumn: "_value")
  |> group(columns: ["_time"], mode:"by")
  |> drop(columns: ["_measurement", "_stop", "_start", "_time", "nas_name", "disk_path"])
  |> yield()
the key line is line:
|> filter(fn: (r) => r["smart_attribute"] == "Current_Pending_Sector" or r["smart_attribute"] == "Load_Cycle_Count" or r["smart_attribute"] == "Helium_Level" or r["smart_attribute"] == "Offline_Uncorrectable" or r["smart_attribute"] == "Power-Off_Retract_Count" or r["smart_attribute"] == "Power_Cycle_Count" or r["smart_attribute"] == "Power_On_Hours" or r["smart_attribute"] == "Raw_Read_Error_Rate" or r["smart_attribute"] == "Reallocated_Event_Count" or r["smart_attribute"] == "Seek_Error_Rate" or r["smart_attribute"] == "Reallocated_Sector_Ct" or r["smart_attribute"] == "Seek_Time_Performance" or r["smart_attribute"] == "Spin_Retry_Count" or r["smart_attribute"] == "Spin_Up_Time" or r["smart_attribute"] == "Start_Stop_Count" or r["smart_attribute"] == "Temperature_Celsius" or r["smart_attribute"] == "Throughput_Performance" or r["smart_attribute"] == "UDMA_CRC_Error_Count")
this is the line where the different smart attributes for your particular drive(s) will need to be edited based on the results from your drives and based on the data displayed by the script when debug=1 is used.
also note, some linux systems use "sata1", "sata2" and so on for their drive naming convention, while others use "sda" and "sdb" and so forth. depending on how you system names the drives the following line will need to be edited as well:
|> filter(fn: (r) => r["disk_path"] == "/dev/sata1")
This is free to use code, use as you wish
Your Name - Brian Wallace - wallacebrf@hotmail.com
Project Link: [https://github.com/wallacebrf/synology_snmp)