Mars Global Surveyor plasma data compared with models.md
Authors Change Log Goals Steps References
R. Modolo 1), S. Hess 1), B. Cecconi 2), V. Génot 3), and the IMPEx 4) team
- LATMOS,Paris,France
- LESIA,Meudon,France
- IRAP-CDPP,Toulouse,France
- http://impex-fp7.oeaw.ac.at
Version : 1
Name : Keyuan Yin
Note : First converted from original site
Version : 2
Name : Michel Gangloff
Updated 2018 November 19
Correction of several typos and update of AMDA windows
- Hands on LATMOS simulation database and Visualization tools (AMDA, 3Dview, TopCat)
- Comparison between MGS observations and Hybrid simulation results
Presentation of LatHyS
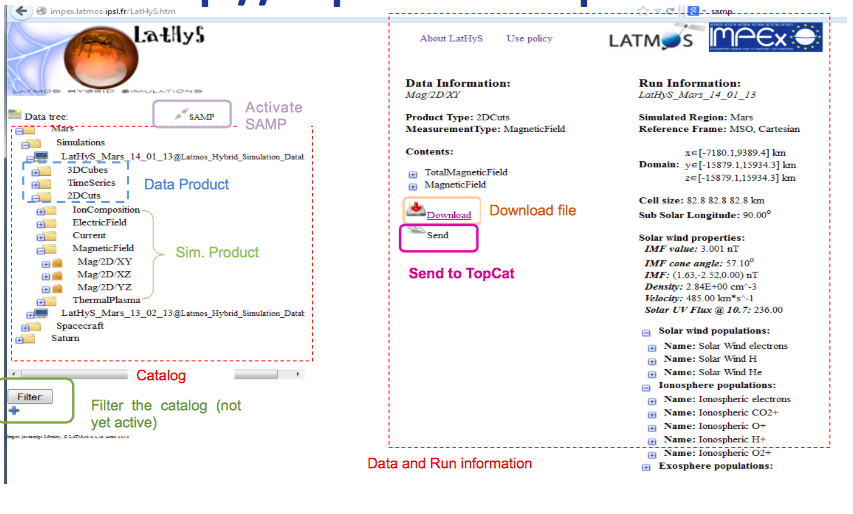
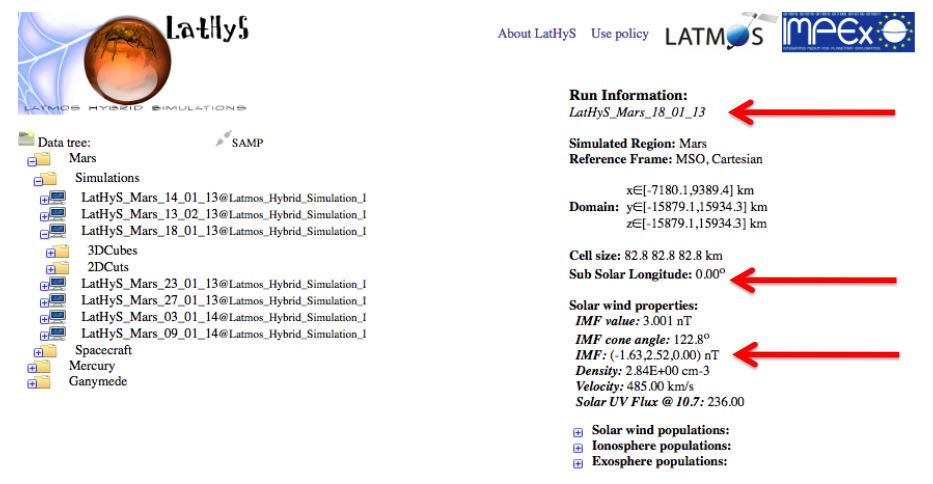
Choosing one Martian simulation :
LatHyS catalog propose the main characteristic of the simulation - The ResourceID (Name) :
LatHyS_Mars-18_01_13@...
- IMF values : (-1.63, 2.52, 0.0) nT
- Sub Solar Longitude : 0 degree (main crustal field on the nightside)
Searching if MGS data have similar IMF values ....
Comparison between MGS observations and Hybrid simulation results using AMDA

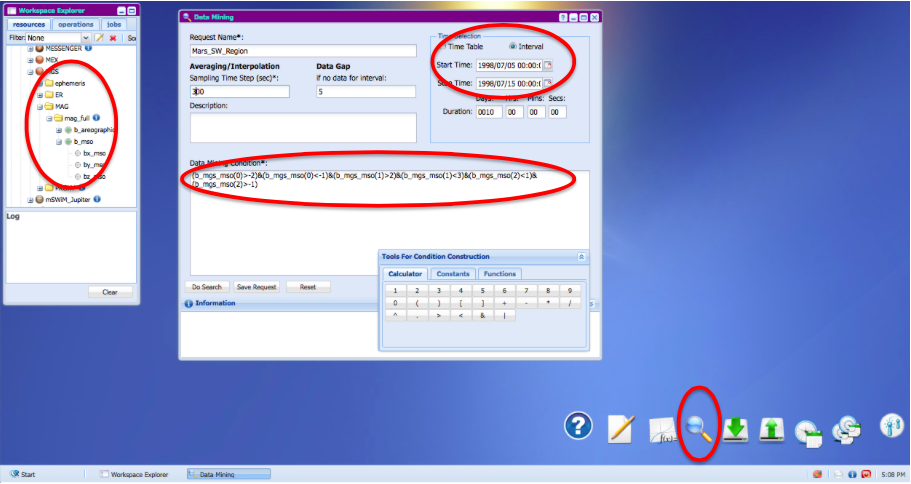
Use Data Mining tool (Magnifying glass)
Construct a data Mining condition by dragging and dropping resources of the workspace explorer (MGS bx_mso => data mining conditions)
The condition mark out the simula1on IMF value : -2<Bx<-1 , 2<By<3, -1<Bz<1
Specify a sampling time (averaging over 300s), the name of the request and the Time interval Start Time : 1998/07/05 => Stop Time : 1998/07/15
Then perform the search...
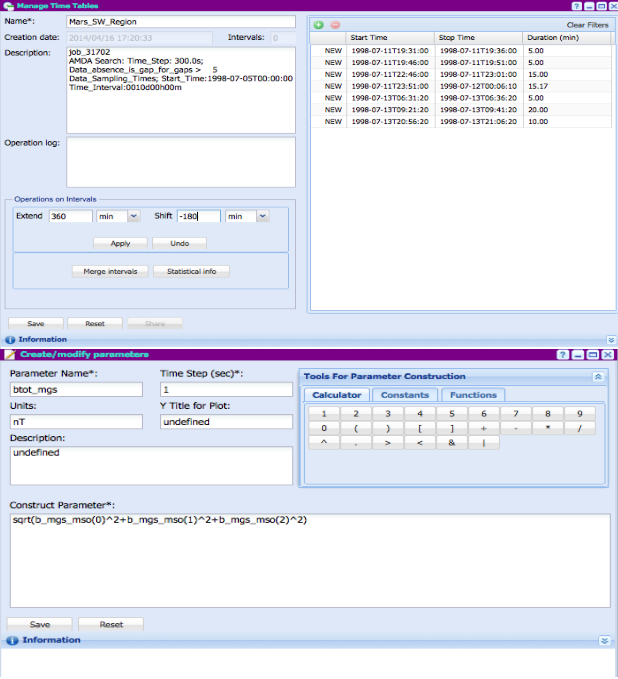
Visualize the Time Table created from the search and manipulate it in order to have about one orbit per event
- Extend all time periods by 360 min (6h) and shift them by -180 min (3h) to have new periods of about 6h centered on your searched time results
- Name your Time Table (Mars_SW_Region)
Create a new parameter corresponding to the Total B field (MGS) Idem by drag and drop
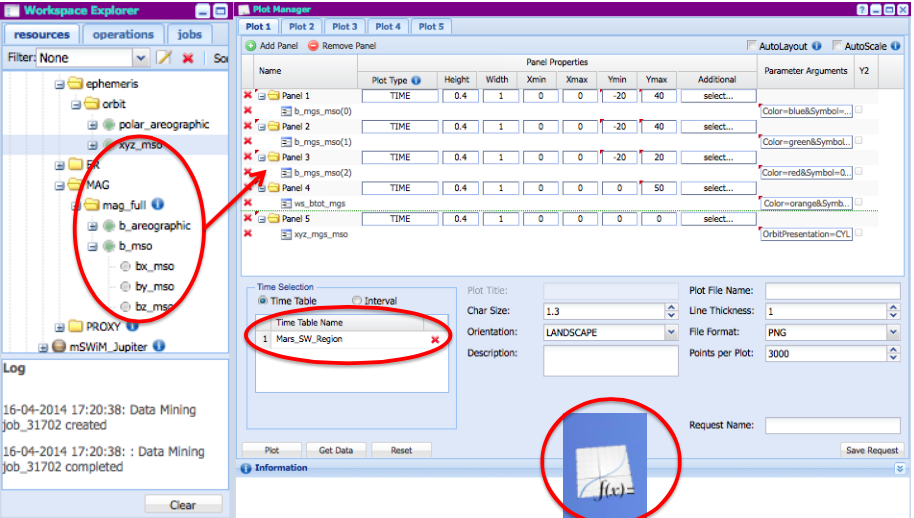
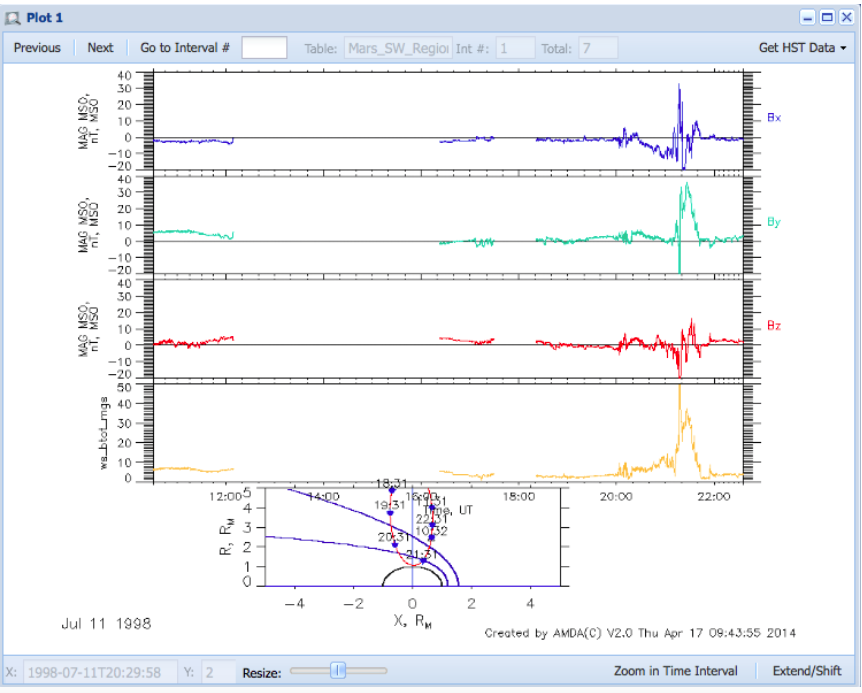
Visualize your data with the plotting data function. Select each component of the MGS magnetic field (MSO) with some color code (bx : blue, by:green, bz : red, btot from derived parameter : orange) + MGS ephemeris (xyz_mso in CYL coordinate system)
For Time Selection : select Time Table and drag and drop the Mars_SW_Region from My_Time_Table
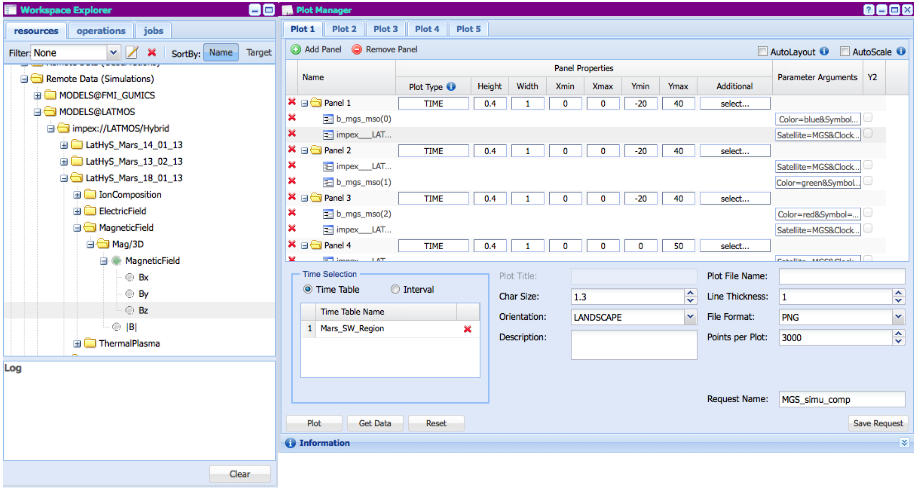
Add simulation result datasets:
Remote data(Simulations)/MODELS@LATMOS/LatHyS_Mars_18_01_13/Magnetic_field Drag and drop each B components and select MGS S/C
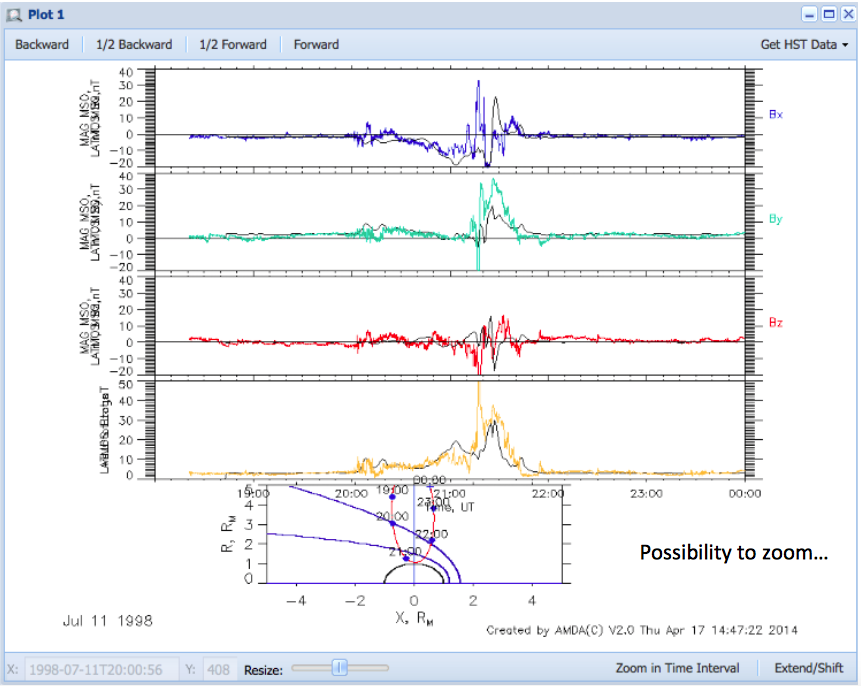
Possibly to zoom
Original Powerpoint PDF version on this site