SpaceGroupDetermination
Once the pattern has been indexed, you have a putative cell and crystal system. The next step is to determine the space group.
-
Probabilistic approach to space group determination (see Probabilistic Approach to Space Group Determination).
-
Identifying systematic absences (see Identifying Systematic Absences with DASH).
-
An example of identifying systematic absences (see Identifying Systematic Absences: an Example).
-
Dealing with space group ambiguities (see Space Group Ambiguities).
-
DASH provides an interface to Extinction Symbol, a program that identifies the most probable space groups for a set of reflections and their intensities(see Appendix I: References). In order to furnish Extinction Symbol with the required information a Pawley fit to the diffraction data must be obtained, in the most general extinction group of the crystal system under consideration. For more information about the Extinction Symbol program please look at the product manual which includes a reference to the published research paper.
-
Once the crystal system and unit cell parameters have been entered, click on Space Group in the DASH Wizard : Unit Cell Parameters window. DASH automatically sets the space group to the most general for the crystal system chosen.
-
Proceed to the Pawley Refinement window (see Sequence of Operations in Pawley Fitting). Select 6-10 individual peaks distributed over the whole 2θ range of the pattern. Once DASH has stable values for the unit cell and peak shape parameters, the DASH Wizard : Pawley Refinement Status window will automatically pop-up.
-
Obtain a good Pawley fit to the data by refining the background, unit cell and zero-point parameters. When satisfied with the fit, launch the space group determination program by pressing the Run> button.
-
The console window for Extinction Symbol appears. Once the program has finished running the results of the extinction symbol determination they can be viewed by pressing Enter on the keyboard. The most probable extinction symbols, along with their probabilities, are displayed in descending order in the right hand column.
-
When the results window is finished with, close the window. In the Pawley Refinement window click <Back. The files that have been generated during space group determination, including the table of results can be removed at this point by clicking Yes in the Confirm dialogue box. The files will not be deleted if No is chosen.
-
The space group associated with the most probable extinction symbol can now be selected from the Space Group drop down menu. Occasionally there will be a choice of space groups for the extinction symbol returned.
-
For guidance, a table listing the extinction symbols with their associated space groups is available (see Appendix F: Extinction Symbols and their Space Groups). It may be also be useful to refer to the table of most probable space groups when deciding which space group to try first (see Appendix E: Frequency of Occurrence of Space Groups).
-
Check the agreement between the calculated Bragg reflections of the chosen space group as shown by the tick marks and the peak positions of the experimental pattern. Please note that the purpose of Extinction Symbol is to provide guidance in identifying the space group; it is not a substitute for good judgement.
-
Perform a Pawley Refinement in the chosen space group, as normal.
-
Systematic absences can be identified in DASH by comparing, for different possible space groups, the observed peak positions with those calculated from the cell and postulated space group. These are represented by tick marks at the top of the profile display.
-
Even if you already have clues about the space group, it is probably best to start by selecting the primitive space group of the appropriate crystal system with no systematic absences (e.g. P2 for monoclinic). Look to see if the gaps in the pattern match the gaps in the tick marks.
-
Zooming the picture helps a lot when assessing whether a peak is matched by a tick mark.
-
Do not worry about tick marks that are not matched by peaks in the profile: they could be systematic absences or weak peaks. However, peaks with no corresponding ticks are a warning. If you do see a peak in the profile with no matching tick mark, the cell is probably wrong, though impurities or instrument spikes should not be ruled out.
-
Having examined the space group with no absences, you can now try space groups of higher symmetry to account for any systematic absences in the pattern. Browse through the space groups comparing calculated and observed peak positions.
-
A useful technique is to cycle through space groups with just one cause of systematic absence (e.g. A2, B2, C2, I2, etc.) since this may enable you to eliminate a complete set (e.g. all C-centred space groups) quickly.
-
It is necessary to look separately at different settings of the same space group, e.g. P21/c, P21/n and P21/a, since the cell from the indexing program could correspond to a non-standard setting.
-
Although you are looking mainly for peaks in the observed pattern that do not have matching tick-marks (since this virtually eliminates that space group), do remember to look for the opposite discrepancy. If there are a lot of calculated peaks that are not observed, you may be looking for a space group with more systematic absences.
-
Another way of identifying systematic absences is to perform a Pawley fit in the space group with no systematic absences. At the end of the Pawley fitting procedure, the output file polyp.hkl can be examined for systematic absences and the space group deduced from these absences.
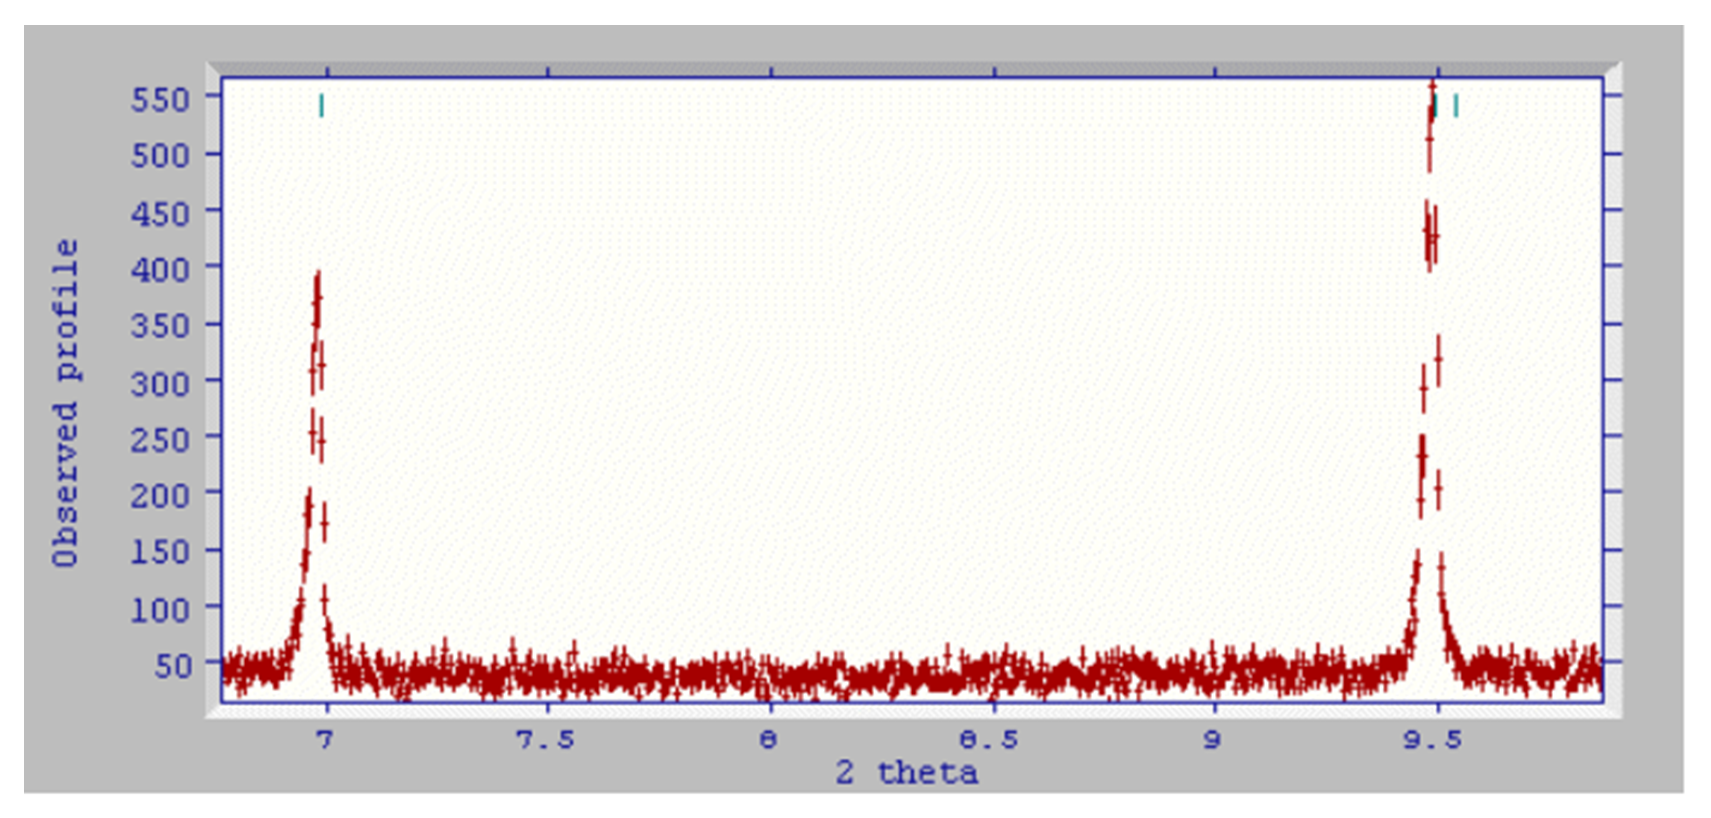
- The tick marks in the following figure correspond to the space group P2:

- The peak around 7.6o 2θ appears to be absent. If the user changes the space group to P 1 21 1 (a likely choice) the graph is updated with a new set of tick marks:
-
The predicted peak at 7.6o is an absence in P 1 21 1; other predicted peaks are consistent with the observed data and so the fit can be performed in P 1 21 1.
-
If you pick the wrong space group, it is often obvious. The following display results if the space group is changed to P 1 c 1. This choice of space group is clearly wrong, since the strong peak at about 7.0o would need to be systematically absent:

-
If it is difficult to decide which of two space groups is a better match to the pattern, you can try toggling between them several times to identify subtle differences between the calculated peak positions. For example, you might find a point at which one of the space groups has two tick marks and the other has only one. If the peak underneath is unusually broad, this indicates that the former space group is slightly more likely.
-
Inevitably, there will be many cases where the space group cannot be determined unambiguously. In this situation, there is little choice other than to try each possibility in turn, starting with the space group that has the highest statistical probability of occurrence (see Space Groups Listed by Frequency of Occurrence ). In extreme cases, it may be necessary to attempt Pawley fitting and even structure solution in all possible space groups.
-
Appendix E: Frequency of Occurrence of Space Groups lists space groups in decreasing order of their frequency of occurrence in the Cambridge Structural Database. A separate listing is given for chiral space groups, if you know that your structure is enantiomerically pure (see Chiral (Sohnke) Space Groups Listed by Frequency of Occurrence).
-
Of course, there are space groups that have identical systematic absences. In such cases, the powder diffraction data alone are insufficient to determine the true space group. In principle, the distribution of structure factors can distinguish between centrosymmetric and non-centrosymmetric space groups, but in practice, powder diffraction data are rarely of sufficient quality to permit this distinction.